Showing posts with label renewable energy credits. Show all posts

Sunday, April 22, 2018

Tolemac Solar – A New Hampshire Community Solar Project

Several of my recent posts have been concerned with solar power in New Hampshire. This topic continues to intrigue me, so I am continuing my explorations. This time I delve into community solar projects.
Solar projects are carried out at different scales. The most common are smaller roof-mounted residential projects that range from 3 to 20 kW. A 5 kW installation typically has about 17 panels. I discussed the financing of these projects in my previous post. The solar operations we often see in the press are large ground-mounted projects that cover acres of land and can involve many thousands of panels. These range from 1000 kW to 1 million kW (1000 MW) or larger and are designed to feed electricity directly into the electrical grid. They are often referred to as utility-scale projects. The largest solar farm in the world is presently the Tengger Desert Solar Park, built by China near Zongwei in the Ningxia region. This monster has a nameplate capacity of 1547 MW, cost about $1.1 billion, and covers a land area of 16.8 sq. milesThe center of the figure below shows a satellite view of this operation, which is located on the edge of the Mongolian Desert.


In NH, the largest operation at present is the substantially smaller 2000 kW operation built by New Hampshire Electric Coop. in Moultonborough. This has 7200 panels and is located on 24 acres (0.04 sq. miles) of land.
Between the small residential (owned by a single individual) and large utility-scale projects (owned and financed by utilities or large development and investment funds), we find community solar projects. These are often in the 50 to 500 kW range and are designed and built so that a group of individuals or organizations can benefit from solar power. Drawing from the concept of community gardens, these projects are often referred to as solar gardens.
The unique aspect of a community solar project is that, even though the solar project is built on a single piece of land and the electricity is fed into the grid at a single point, the members of the solar farm community are not directly wired to the project. Instead they are “virtually connected” – they are bound by a legal agreement and they reap the benefits of solar power without having to install solar panels on their property or residence.
This idea is based on the concept of group net metering. One of the members, the host, takes on the responsibility of hosting the project on their property and then shares the benefits with the solar community that the host assembles. Again, it is important to note that the members do not have electrical meters directly connected to the project, nor do they have to make changes to their electrical service: they benefit by getting their share of the solar benefits/credits as if they were connected. Their benefits are directly proportional to their allocated share of the project and the output of the solar array that is located elsewhere; however, the members cannot get benefits exceeding their total electricity consumption.
If you have the opportunity and are invited to join a solar community, this is a great way to become involved with solar without having to take on the burden of installing and owning of solar operation yourself. You might not have the funds for your own solar installation or a residence that is correctly positioned with a south-facing roof, but, as part of a solar community project, you could benefit as if you had your own installation.
It is always easier to understand how these concepts work by taking a look at an example. One of the first projects of this type in NH was the 164 kW Tolemac Solar project  that was installed by Frank Grossman on his property in Hollis, NH. This project went live in January 2017.
I had the opportunity to visit the project last year and to chat to Frank. In the process, I learned more about the project and what was involved in getting it up and running. Frank Grossman is an interesting guy and has been in the tech business for many years and has started up and sold several companies. He is driven to make a difference in the world and he has spent the last few years committing his own time and money to ideas that he considers to be important, such as solar power and high energy efficiency buildings.
Some years ago, Frank decided to install a solar system, but he wanted to make an impact and install a system larger than for just his residential use. He opted to build a 164 kW facility with 507 panels on his property (see the photo below for an aerial view of the completed array.) Frank certainly didn’t need this size operation for own needs (a typical residential system is 3 to 10 kW in size), so he assembled a group of 21 neighbors, friends, and local non-profits to benefit from his solar project. This “solar community” assembled by Frank benefits from the renewable power that his Tolemac project generates. The members are not wired to the project so there is no need for them to be adjacent or even nearby the project. In fact, one of the Tolemac community members is 15 miles from the Tolemac project. They just had to be members of the same utility—in this case, Eversource—and not getting their electricity from a competitive supplier. For the community members, this was an easy and straightforward decision. They had to sign a short legal agreement and, after sharing their electricity bills, they get quarterly checks for their prorata share of the electricity generated from the project. “It couldn’t have been easier”, said one of the members.


However, for Frank it was anything but easy. He provided the funds to build the array, he managed it, and dealt with the very complicated regulatory and administrative issues that accompany a first-time project of this sort. He worked with the utility, filed the paperwork, dealt with delays and obstacles, and worked hard to get local ordinances in Hollis changed so that the project could move forward. For Frank, this was a two-year journey and he learned a lot of lessons along the way. The most important was the need to educate a large group of stakeholders, which included not only the Tolemac community members, but also his neighbors and townspeople, the Town Planning Board, and the various lawyers he employed. He also had to work with the utility to reroute and upgrade the local electrical grid near his home. This was an expensive upgrade and involved the installation of 10 new utility poles.
Frank is the owner of the system and his motivation for this project was altruistic. He wanted to make a difference and his community members are subscribers. They do not own a share of the system: they simply receive the benefits from his project and enjoy lower electricity prices as a result. Frank has taken on all the risk, he paid for the system, he did the hard work, and he now keeps track of the administrative details. He gets paid by Eversource for the electricity sent into the grid and then sends out checks to his community for their agreed share. A total of 45% of the net-metering benefits are paid out to members. The rest is income to the project that is used to offset the original cost of investment. The installed cost of the Tolemac project was $3.21/Watt and, at the time of installation, the projected payback was of the order of 13 years.
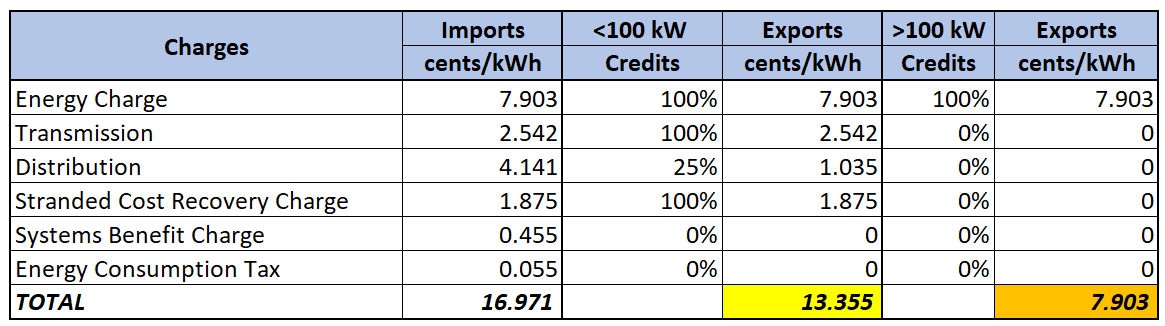
Frank’s project generates about 250 MWh per year: compare this with a 5 kW residential system that generates ~6.5 MWh per year. Now, because the Tolemac project is larger than 100 kW, it is considered a large generator in NH and, as such, does not get all the net-metering benefits of smaller residential projects (see my earlier post for net-metering details for smaller residential solar projects). The Tolemac project only gets credit for electricity produced at the default rate and none for distribution and transmission costs. Solar projects that are less than 100 kW in size get credit for the electricity generated at the default rate, as well as the other kWh-based charges such as transmission and distribution costs. The table below shows a comparison of the net-metering benefits of small (<100 kW) and large (>100 kW) projects in NH. Based on present Eversource rates (April 2018), a smaller residential project would get paid 13.36 c/kWh for electricity exported to the grid. The Tolemac project gets a much smaller amount and presently only earns 7.90 c/kWh. An additional source of revenue for the project is the sale of solar renewable energy credits. The price of these varies and is presently of the order of $15 per 1000 kWh of solar energy produced.

There are several such solar projects located through New Hampshire and they are becoming increasingly important. The Peterborough project I wrote about previously is essentially a community solar project but, in this case, the community is various municipal buildings in the town of Peterborough. Solar power is generated at the municipal wastewater treatment facility and, through a group net-metering arrangement, the benefits are shared with the treatment facility and other town buildings. The 1000 kW solar installation on the capped landfill in Milton, NH (see photo below), is also a community solar project.


Group net metering is not just reserved for solar power. It is a concept that can be applied to other forms of renewable power, such as hydro. I will discuss these types of projects in a future blog post.
In the meantime, enjoy your solar benefits if you have your own system or are part of a solar community, but, even then, remember to turn off the lights when you leave the room.
Mike Mooiman
Franklin Pierce University
mooimanm@franklinpierce.edu

Tuesday, September 19, 2017

Solar Power in NH – Part 5 - Financing a Residential Solar System in New Hampshire

In this post, I take a closer look at funding a residential solar photovoltaic system in New Hampshire. Solar power has received a lot of coverage recently because the State rebates for new solar systems have been halted due to a lack of money in the Renewable Energy Fund that is set aside for this purpose and there have also been changes in the net metering regulations. The key point I want to make in this post is that there are still a lot of good reasons to install solar in NH - the net metering changes and the lack of a state rebate should not deter you.
Among the many good reasons to install solar on your home in NH are the following:
  • Electricity prices in NH are high and the production of your own solar power will provide you with some protection from further increases;
  • There is a generous federal investment tax credit on the installed cost of your solar system;
  • You have the ability to earn money through the sale of renewable energy credits (RECS);
  • Net metering of electricity in NH means that you get credit for the excess solar generated electricity that you feed into the grid during the daylight hours and you only pay for the net amount of electricity that you draw from the grid;
  • NH state rebates on the costs of installed solar might become available again in the near future.
In this post, I look at a typical system and figure out how these incentives come into play so that your solar system will eventually pay for itself over time. For my calculations and the rest of this discussion, I have assumed that a homeowner installs a 5 kW solar system (about 17 panels) at an installed cost of $15,000, which would produce 6500 kWh per year, and that the homeowner uses about 600 kWh/month (7200 kWh/year) of electricity at a rate of $0.16/kWh. I have also assumed that the homeowner lives in an area where there is a property tax exemption for installed solar. (See the NH Office of Energy and Planning website for a list of NH towns with property tax exemptions for solar installations.)
One of the most important incentives for residential solar systems is the federal investment solar tax credit. This program provides you with a tax credit of 30% of the installed cost of your solar system. This program is in effect until 2019, but the tax credit begins to decrease in 2020 and, beyond 2021, the program has not been renewed and it is possible that it will no longer be available in the future.
Another good incentive is the rebate provided by the NH Public Utility Commission (PUC). Until recently, a homeowner could receive up to $2500 from the Renewable Energy Fund administered by the PUC.. However, this program is presently on hold as has been reported in the press. The program has been a popular one and, owing to the flood of applications, the PUC has had to cease approving projects and awarding rebates until they know how much money they have to work with. The funds for this program come from Alternative Compliance Payments paid by the utilities. As noted in a previous post, these vary from year to year and the funding available from this source is unpredictable. I expect that the PUC will go back to funding projects, but not all installations will be able to get rebates and I expect the rebate amounts to be smaller. For the purposes of my analysis in this post, I have assumed that the rebate is not available. If you are fortunate enough to be awarded a state rebate in the future, this will just improve the cash flow and payback on your solar investment.
Another incentive is the sale of RECs, which I discussed in a previous post. Solar has a special carve-out class – Class II – in the NH Renewable Portfolio Standard: for every 1 MWh (1000 kWh) of electricity you produce from your solar system, you can sell the equivalent REC. Class II solar RECs are presently selling for between $15 and $20, so, if your 5 kW solar system produces 6500 kWh/year, you could sell your six RECs for  $15 each to earn an additional $90. However, it is important to keep in mind that, as a small producer of RECs, the administrative and commission costs involved in tracking, verifying and selling those RECs could be of the order of $50, eating up a good amount of  your REC income. To benefit to a greater degree from REC sales,  homeowners would need higher RECs prices or should install a larger solar system to produce more RECs to defray the administration costs.
Net metering is an important incentive but as of June 2017, new regulations were issued by the NH PUC, which reduced some of the monetary benefits of net metering. With the new regulations, homeowners, whose exports of power exceed their consumption, will receive a reduced rate for their monthly net exports. I discussed this in detail in my last post and determined the rate reduction would be of the order of 20%. Homeowners with monthly net imports will continue to pay the retail rates for their net imports but the non-bypassable charges are treated separately. These charges, which include the system benefits charge, stranded cost recovery charge, and the state electricity consumption tax, are of the order of 0.5 cent/kWh and will be billed for every imported kWh no matter how much electricity is exported. The homeowner will not receive any credit for these charges for their exported kWhs.
To get a better appreciation of net metering at work, consider the following chart which shows the projected usage and solar generation for that typical NH home with a 5 kW solar system. The chart was prepared using generation data from the PVWatt calculator and residential load profiles for a NH residence from the Department of Energy. The graph shows monthly usage and generation and is different from my graph in my previous post which charted hourly data. The monthly view is important one as net metering is presently carried out on a monthly basis. The data shows that in the winter months, October to March, electricity demand is greater than solar power generation so there will be a net import of electricity into the home in those months. Homeowners would pay retail prices for those net monthly electricity imports. For the summer months, April through September, the amount of solar generation is greater than usage so there will be a net export of electricity and the homeowner would earn the lower export rates for their net exports during those months. My calculations indicate that, for the NH home we are considering in this post, a 5 kW solar system would save a homeowner $990 in electricity charges over the year. This is about $57 or 5% lower than the savings that would have been expected from net metering before the recent set of changes to the net metering regulations.

With these incentives in mind, let’s look at funding a solar system. There are three basic ways that homeowners can finance their solar systems:
  • The first, and very popular with frugal northern New England Yankee types, is simply to buy the system outright using savings. The system then pays for itself through electricity savings, the federal solar tax credit, REC sales, and, if available, the NH rebate.
  • The second is taking out a loan from a bank to fund the solar system and paying it back over a number of years. For the purposes of my calculations, I have assumed a $15,000 home equity line of credit (HELOC) with an interest rate of 6%, no down payment, payable over 15 years, and that the interest payments on the loan are tax deductible.
  • The third approach is having a solar company pay to install the panels on your roof and you sign an agreement, known as a power purchase agreement (PPA), to purchase electricity at a reduced rate for an agreed number of years (typically 15). In a variant of this approach, known as a solar lease, you can end up owning the system after a number of years. The advantage of this approach is that there are no upfront costs, no bank loan, and you benefit during the period of the agreement from reduced electricity rates. However, in this approach, the solar company makes the investment and benefits from the incentives.
Each of these approaches have their respective pros and cons and will work for you in different ways – what is right for you depends on your savings and financial situation and how long you plan to be in your home. I took a look at each option and calculated the annual cash flows  over 15 and 20 years to compare how much money each of these options would put into your pocket. My key assumptions are that the electricity price is currently 16 cents/kWh and will increase by 2%/year, that RECs are $15 each and prices will decrease by 5%/year and that the administrative costs involved in selling RECs are $50/year. The results for all three financing options are plotted below.
The outright purchase option is plotted in blue. The initial outlay of $15,000 for the system is offset in the first year by the federal solar tax credit, the electricity savings of $990/year and REC sales of $90 (offset by the associated administrative costs and commissions). Every year thereafter, the initial capital outlay is offset by the annual electricity savings and REC sales. Early in the ninth year, the cumulative cash flows go from negative to positive. This is the payback point, so the payback period would be just over 9 years. After this, the investment is cash flow-positive and, by Year 15, the cumulative cash flow from the project is almost $7000. By Year 20, it will have risen to almost $14,000. Another way to view this financing option is that it is equivalent to making a $15,000 investment and earning a 8.7% return over 20 years, a return which, for most of us, is very hard to find these days. (Should the NH rebate become available, the project cash flows would be larger, the payback period would improve to 7 years, and the 20-year investment return would increase to 11.7%.)
Should you not have $15,000 available for a solar investment, you could consider taking out a loan for the solar system. There are a number of solar-system-specific deals available from NH lenders but, for this post, I have assumed a simple 6% home equity loan paid back over 15 years with tax-deductible interest. The cash flows are shown in orange in the chart above. The attraction of this option is that there is no initial cash outlay on your part and you benefit right away in the first year from that $4500 federal tax credit, which immediately puts that nice stack of money in your pocket. Going forward, you then have annual benefits of electricity savings and REC sales, but you also have loan payments of approximately $1520 per year. In this scenario, your annual loan payments are higher than your annual savings and that, over time, eats into that Year 1 tax benefit. By Year 15 your loan has been paid off and, from that point on, you benefit fully from your electricity savings and REC sales. By Year 20, the cumulative cash flow from the project will have risen to ~$8100.
The third option, popular with many homeowners in other states, is to have a solar company install a system on your home and then sign an agreement with them to purchase the produced solar power at a rate lower than the prevailing utility rate. For this case, I have simply assumed no outlay on the part of the homeowner and they get to purchase solar generated electricity for 13 cents/kWh, instead of 16 cents/kWh, giving an annual saving of ~$200. The cash flows for this option are shown in green - the cumulative cash flow from the solar project by Year 15 is approximately $3400; by Year 20, it will have risen to $4700.
Should you have different numbers and want to consider different system sizes, interest rates, or loan periods, feel free to use the Excel-based calculator that I have posted on this site and see what works for you. Please use the calculator as a guide only. Collect as much information as you can from other sources, get multiple quotes for your solar system and quiz each solar company on their payback calculations. Ultimately the more informed you are, the better your decision is likely to be. If you have questions or comments about the calculator, please reach out to me via email.
I have summarized the 15- and 20-year cash flow information for the three options in the table below. If we look at the cash flows for the project, it is clear that the best option, assuming that a homeowner has the funds, is the outright purchase of the system. The loan option, especially after 20 years when the loan has paid off, starts looking good as well. The least favorable option, over the 20-year view, is the PPA; however, if you don’t have the funds, and don’t want to take out a loan, it might be an interesting possibility.

Many of us don’t like home-investment projects with long payback periods or lengthy loans unless we are committed to staying in our homes for an extended amount of time. A report from the Lawrence Berkeley National Laboratory indicated that solar panels do increase the value of your home, but this only applied to homes with an owned solar system and not to homes where a solar company owned the system. So, if you pay to install a solar system and sell it before reaping all the long-term energy savings, you should gain from a higher sale price.
Take a look at the solar calculator I have developed and, if you have not done so already, seriously consider installing a solar system on your home. It will put money in your pocket over the long term, it will partially shield you from future electricity rate increases, and, most importantly, you will be helping to reduce greenhouse gas emissions from the burning of fossil fuels. In the meantime, while you are contemplating installing a solar system, remember to turn off the lights when you leave the room. 
Mike Mooiman
Franklin Pierce University
mooimanm@franklinpierce.edu

Sunday, June 11, 2017

New Hampshire's Renewable Portfolio Standard – Part 4

My last three posts have looked into various aspects of NH’s Renewable Portfolio Standard (RPS). I presented the basic workings of the program,  discussed renewable energy credits (RECs) and REC prices and, most recently, looked at money flow and costs of the RPS program.  The program originally included a steady increase in the renewable energy (RE) requirement year on year; however, to reduce costs to electricity customers, some big adjustment in the requirements have been made over time to accommodate changing market conditions and the non-availability of RECs in specific classes. This post discusses the implications of some of those changes as NH gets back on track to meet its 2025 RPS goals. 

As noted previously, there are four classes of renewable energy in the NH RPS. Class I is for newer RE technologies, such as wind or ocean energy, and RE operations that have been commissioned since 2006. Class II is a special carve out for solar power. Classes III is for the older biomass operations, which include electricity generated from burning landfill methane or wood, and Class IV is for smaller hydro operations that were established prior to the end of 2005.

NH has an important forestry industry and eight wood-burning plants that generate electricity. Right from the start of the RPS program, a large Class III requirement  was put in place to support these wood-burning plants; however, from 2012 to 2016, the amount of RE from Class III was significantly curtailed to cope with the shortage of Class III RECs and to mitigate the cost of the shortage for ratepayers. The reason for the shortage was that the Connecticut (CT) REC market had high prices and had sucked in RECs from all over New England, including NH Class III RECs that qualified as CT Class I RECs. With limited NH Class III available, electricity suppliers would have been compelled to pay the Alternative Compliance Payment (ACP) instead, increasing costs to ratepayers.

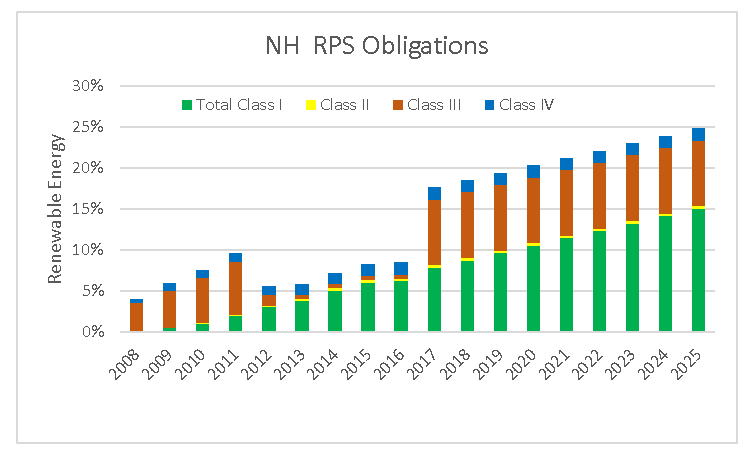
In 2016 the NH Public Utilities Commission (PUC) held hearings on the topic and  were informed  that the REC market had changed, that CT REC prices had decreased, and there was testimony from the biomass coalition that sufficient Class III RECs would be generated and be available for purchase. Electricity suppliers weren’t convinced and, after deliberation, the PUC commissioners ruled to return the Class III requirement from 0.5 to 8% to put NH back on track to meet its RE ramp-up to meet the 2025 obligation, as shown in the chart below.


For 2017, the specific RE class requirements and associated ACPs are presently as follows:


Given this big ramp from 0.5% to 8%, I though it worth taking a closer look at the Class III REC market and the availability of biomass RECs to meet this requirement.

Let’s start with some basic calculations. Approximately 11,000,000 MWh of electricity are supplied annually to ratepayers and customers in NH. It follows that an 8% Class III requirement therefore needs to provide 880,000 MWh of electricity from pre-2006 biomass operations. The REC requirement is therefore also 880,000 MWh. That is a boatload of RECs – and the question is: Can that many RECs be generated from this source?

I then found the list of registered Class III providers at the NH PUC, which is provided below.


Closer examination of this list brings to light the following:

  • There are 20 registered Class III operations, providing a total generating capacity of 137 MW. Most of the operations (13 of 20) are from out of state.
  • Only three of NH’s eight wood-burning plants (highlighted in green) are registered as Class III producers: the rest, such as the large Berlin biomass operation, appear to be registered as Class I producers.
  • Of the 137 MW of Class III capacity available, the NH wood-burning plants only provide 56 MW, or 41% of the total capacity: the rest comes from in-state and out-of-state landfill methane operations.
  • If we include the NH landfill methane operations (highlighted in grey) with the NH-based wood plants, only 68 MW, or 49% of the total capacity, is provided by NH-based plants: the rest is from out-of-state landfill gas operations in RI, NY, and VT.
I found all of this surprising because my understanding is that the original intent of including the Class III category in the NH RPS was to support NH biomass operations.  Instead, in its present form, it seems to be doing a lot to support out-of-state landfill operations.

Let’s return briefly to some calculations. If we take that 137 MW of Class III generating capacity and assume that the generating plants are operational for 90% of the time (see my I’ve Got the Power post for a discussion of capacity factor and the difference between generation capacity and energy), we can determine how much electricity should be generated over one year: 137 MW x 0.9 x 365 days x 24 hours/day. This calculation gives 1,080,108 MWh or RECs. This is a useful result because it suggests that there could be production of sufficient RECs to cover the 880,000 that we need. In fact, the calculation suggests that we might potentially have an excess of Class III RECs, which hopefully will drive their prices down and save money for NH ratepayers.

REC producers in New England are required to register and file their REC production data with the New England Power Pool Information System (NEEPOL GIS). Some of the data is available to the public. I noted that in 2015 and 2016, 1,005,258 and 924,716 NH Class III eligible RECs were produced, respectively. This is right in line with my calculation of 1,080,108 RECs. Historically, there seem to be sufficient Class III RECs to meet NH’s needs.

However, availability does not obligate producers to sell into the NH REC market. They could, especially if prices are high, elect to sell, as in previous years, into other markets, such as the CT Class I market. If insufficient Class III RECs are available, prices will quickly rise close to the Class III ACP cap of $ 45. As a biomass RE generator, that is what I would want and I might choose to direct some of my RECs to a different market to support higher NH Class III REC prices. This is a direct consequence of our inconsistent and changing REC market in New England. It provides opportunities for good traders to play off the differences between markets—and it makes perfect business sense to do so.  

However— and this is a big HOWEVER— the calculation of a surplus assumes that all operations run 90% of the time, that there are no major shut downs at any of the larger facilities, and that biomass REC producers don’t elect to sell Class III in other eligible markets. Another complicating factor is that there is legislation, known as SB129 presently making its way through the NH General Court that makes important modifications to the RPS program, especially in the Class III category. Just last week, the NH House approved a change in the RPS law that promotes NH biomass in two ways:

  • It would put a 10 MW limit on the size of landfill methane operations that qualify for Class III RECs. This change appears to be directed at eliminating some of the large out-of-state landfill operations from RI and NY that have been participating in the NH Class III market.
  • The ACP for Class III RECs would be increased to $ 55, which should increase the REC prices in the case of a Class III REC shortfall.
If we go back to the list of Class III operations above, I have highlighted two potential operations that may not qualify for the production of Class III RECs under the new 10 MW limit: the first is the large Johnston landfill in RI, highlighted in orange, and the second, highlighted in blue, is the Seneca landfill in NY (if its combined output is considered).  If both of these landfills are excluded, this would lead to a 36.3 MW reduction in Class III REC generation capacity, which represents an overall decrease of 26%. This would result the production of only 794,000 RECs, which is short of the 880,000 that NH needs in Class III. What are the consequences of this shortfall?  This means that the prices for Class III will climb to close to the value of the price cap (the ACP) and the shortfall will be made up by utilities having to pay the ACP. 

The next question is: What are the implications of these changes to NH ratepayers? Let’s turn again to some calculations and assume that those 794,000 RECs sell for 90% of the $ 55 ACP, or $ 50, and that the shortfall of 86,000 is paid in as the $ 55 ACP. In this case, we can calculate that the Class III requirement of 8% and the higher ACP could cost NH electricity customers some $ 44 million annually. If we apply this amount over the 11 billion kWh of electricity sold annually in NH, the rates can be expected to increase by 0.4 cents/kWh. For a NH residential customer using 600 kWh per month, this could result in an annual electricity cost increase of about $ 30. 

I did extend this calculation to determine a total cost for the RPS program for 2017 based on lower Class I REC prices and some significant assumptions on REC availability and prices in the other classes. My calculations led to an RPS cost of approximately $77 million which is 4.7% of the $1.7 billion I’m assuming will be paid for electricity by NH ratepayers in 2017 (based on $150/MWh ($0.15/kWh) retail rate and 11 million MWh of electricity). This is a significant increase over the 2.6% value I calculated for the 2015 RPS program in my previous post.

Now, bear in mind that these are rough back-of-the-envelope calculations; they do, however, give a sense of the potential implications for NH ratepayers of the Class III ramp up to 8% combined with the proposed RPS SB129 legislation. Perhaps I am dead wrong in my assumptions. Maybe the Class III generators will produce RECs beyond their rated capacity, perhaps not all of those highlighted out-of-state landfills will be excluded from the Class III list, and perhaps the Class III generators will choose not to sell any of their RECs into the CT Class I market. In this case, a surplus of Class III RECs will be produced, prices will be much lower, and the costs to NH ratepayer will be reduced. There is even the possibility that the PUC could jump in again to ratchet down that Class III requirement, as they have in previous years. Regardless, this is certainly food for thought as the SB129 legislation makes its way through the lawmaking machine and onto the Governor’s desk.

This is a complicated matter and it presents a huge dilemma for legislators, regulators, and the wood-burning plants in NH. On one hand, as pointed out in my post, Between a Rock and Hard Place, the NH wood-burning plants absolutely need the REC revenue and higher REC prices to survive. In fact, one such plant, the Indeck Energy plant in Alexandra, recently closed down  due to low wholesale electricity and REC prices. Alternative forms of electricity generation are also very important and wood-burning capacity helps to reduce our dependence on natural gas-fired generation. But, on the other hand, legislators and the PUC commissioners need to weigh the cost of the REC-based subsidies of the biomass industry against costs to ratepayers. There are no easy answers and these are difficult decisions to make.

Feel free to weigh in on this issue because it is a surprisingly important one. In the meantime, do your part to reduce our need for electricity from any generation source by remembering to turn off the lights when you leave the room.

Mike Mooiman
Franklin Pierce University
mooimanm@franklinpierce.edu


Monday, May 29, 2017

New Hampshire's Renewable Portfolio Standard – Part 3

In previous posts, I provided some introductory information about the Renewable Portfolio Standard (RPS) in NH, as well as specific information about Renewable Energy Credit (REC) trading and pricing. In this post, I take a closer look at the money flows in the RPS program and what it costs NH ratepayers.
                    
But first a quick review. Electricity providers in NH are required to source a certain percentage of their electricity from renewable energy (RE) sources by purchasing RECs generated by RE operations. There are different classes of RE and obligations for each class. RECs are a tradable commodity: their prices depend on supply and demand, which are driven by the various RPS requirements in each state. There is a upper limit on REC prices: as noted in my previous post, the Alternative Compliance Payment (ACP) sets a price cap on what the utilities are required to pay for each REC. If prices of RECs are above the ACP, the utilities are obligated to pay the ACP instead. When there is a shortage of REC in a specific class, their prices quickly rise to the ACP value set for that class; when a surplus occurs, REC prices can drop way below the ACP.

The flows of money (black) and RECs (green) within the RPS program are shown in the figure below. NH electricity suppliers, which include the four electrical utilities (Eversource (PSNH), Liberty, Unitil, and the New Hampshire Electric Cooperative) as well as the competitive electricity suppliers (for example, Constellation and TransCanada Power, among many others), can purchase RECs from NH RE plants or from RE generators in other states, as long as the generators meet the NH class requirements and are registered with the NH Public Utilities Commission (PUC) for that class. Some utilities have entered long-term contracts with RE generators  to buy electricity and the associated RECs directly. An example is the power purchase agreement between Eversource/PSNH and the Berlin Biomass facility that was put into place in 2011. These power purchase agreements have to be approved by the PUC.


When there are insufficient RECs available to meet the various class requirements or if REC prices are higher than the NH ACP, electricity suppliers are obligated to pay the ACP to the PUC. These payments go into the Renewable Energy Fund, which is used to support RE projects in NH. These projects, in turn, generate more NH-based RECs, which can then be purchased by electricity suppliers in NH.


Ultimately, the RPS program is paid for by ratepayers or customers of the various electricity suppliers because all monies paid out by electricity suppliers, either to buy RECs or in ACP payments, are bundled into their overall costs, which then find their way into the rates that the supplier charges its customers or ratepayers.


The money for the RECs is paid directly to the RE generators and is a valuable source of revenue for them. The wholesale price for electricity in NE is typically about $30/MWh, so the additional revenue from RECs, which can range from $10 to $55/MWh, is a very important part of their income. In fact, most RE projects could not survive without the REC income and, for many, it comprises the larger part of their income.

These RECs are, in effect, subsidies for RE generation. It is these subsidies that cause opponents of the RPS a great deal of angst: they view these subsidies as picking winners and losers in the energy market – the winners are subsidized RE generators over fossil-fuel based losers. However, another way to view these subsidies is to consider that they provide stimulus for innovation. We all live our very modern and connected lives due to innovation that has been driven by public policy. Just think of improvements such as microprocessors, vaccines, and the internet, all of which had their origins in government-funded research that was paid by our tax dollars. The RPS is similar: it is a public policy that provides subsidies that allow innovation in the energy field to take place; once technological advancement has proceeded to a certain point, the new technologies can stand on their own merits and compete head-to-head with non-renewable technologies.

One hitch with RECs being a revenue source is that it complicates the wholesale markets for electricity. Revenue from RECs is often much greater than that from the sale of electricity: RE generators want to sell power, regardless of how low electricity rates drop, so that they can generate the associated RECs and earn that income. There are times when RE operations, especially the larger wind operations in New England, will bid into the electricity market at zero or even negative prices, just to earn the REC-based revenue. This can cause market distortions and complicate the economics for non-RE plants, such as nuclear, that are not similarly subsidized.

Let’s turn our attention to those ACP payments. As noted previously, when there are insufficient RECs available to meet the various class requirements or if prices are higher than the ACP, the utilities are obligated to pay the ACP. That money goes into the Renewable Energy Fund, which is used to supplement funding for RE generation by state and local governments, commercial and industrial enterprises, and smaller residential-based projects.

The Sustainable Energy Division of the PUC administers the Renewable Energy Fund and runs two types of programs: a rebate program and a grant program. The rebate program provides direct financial support for commercial, industrial, and residential projects involving the installation of solar photovoltaics (PV), solar hot water, and wood-pellet furnaces. The grant program is a competitive scheme for the installation of RE projects at commercial and industrial operations. There is a rigorous selection process to determine which projects receive funding. The focus of the grant programs changes depending on the particular RE needs. At the moment, the preference is for thermal and small hydropower projects because there are REC shortfalls in these classes and attention is required to get additional facilities up and running to generate more RECs. Funding and disbursement of funds through the rebate and grant programs are reported annually by the PUC. This makes for informative reading if you are interested in these matters.

As can be seen in the figure below, ACP payments fluctuate significantly from year to year depending on a host of issues, including the NH RE requirement (which can ramp up annually), REC prices in other states, eligibility of NH RECs in other states, the number of RE facilities coming online and adding their RECs to market, and operational issues, such as shutdowns at larger RE plants. The ACP payments are typically of the order of $1 to $4 million, but, in some years when there was a shortage of Class 1 RECs, they were very high: in 2013, the total ACPs were $17.5 million; in 2011, they exceeded $19 million. Over the past few years, those very high ACPs have abated as the shortage of Class I RECs has subsided.


I took a look at the most recent report of ACP payments and used the data, plus some calculations, to generate the table below. Based on 2015 retail sales of electricity and the prevailing ACP rates at that time, I calculated that if no RECs were available in any of the classes, the total ACP payable would have been ~$47 million. However, the actual ACP amount paid was only $4.2 million—9% of the maximum payable— which indicates that the electricity suppliers were able to source the difference (91% of their REC needs) from RE generators.


The data also show that, for Class I Thermal and Class IV, more than half of the RE obligation was met by paying the ACP. For the other classes, most RE obligations were met by purchasing RECs, indicating their ready availability, for the most part, in these classes. It is this shortage of Class I Thermal and Class IV RECs that has shifted the focus of the NH PUC Renewable Energy Fund to promoting and supporting thermal and small hydropower projects.

Information on the ACPs is readily available, but, interestingly, that for RECs and what the electricity suppliers pay for them is not. This information is considered confidential and only manifests in the rates that the suppliers charge. For a data geek like me, this is a little disappointing, as I think more transparency would be useful here: we could learn about the origins of the RECs being purchased and see how much is used to support in-state and out-of-state projects. This information would also allow us to determine exactly how much the RPS program costs NH ratepayers. As I noted previously, the extra money paid for RE in the form of RECs or ACPs is funded by rate payers via local electricity rates, but this begs the question: How much does the RPS plan cost NH rate payers? A key piece of information—the costs of the purchased RECs in the different classes—is missing.  

Although this information is not directly available, I made some assumptions, using  historical REC prices, and calculated that, in 2015, the costs of the ACP payments and REC were of the order of $40 million. This is 2.2% of the $1.8 billion that was paid for electricity by NH ratepayers (based on $160/MWh ($0.16/kWh) retail rate and 11 million MWh of electricity). This is in line with data calculated by the Berkeley Lab, which determined that RPS costs for NH were 2.7% in 2012 and rose to 3.2% in 2014.

My calculations were, however, carried out using the 2015 RE requirement of 8.9%.  As we climb up to the 2025 level of 24.8% RE, we can anticipate that costs will increase. Based on moderate electricity use and rate increases, I have calculated that, in 2025, the costs of RPS compliance will be a maximum of 8% of electricity rates, assuming only ACP payments, but are more likely to range from 3% to 5%, depending on the availability and pricing of RECs over the next eight years. 

This post has taken a look at money flows in the RPS program and seen how ratepayers ultimately subsidize RE projects through their electricity suppliers purchasing RECs and paying the ACPs. The program presently adds about 3% to NH electricity rates, but it can be viewed as an important stimulus for innovation of RE sources as we, over time, deplete our resources of fossil fuels.

In the meantime, do your bit to reduce our needs for both renewable and fossil fuel-generated electricity by remembering to turn off the lights when you leave the room.

Mike Mooiman
Franklin Pierce University
mooimanm@franklinpierce.edu