Showing posts with label NHPUC. Show all posts

Wednesday, January 22, 2020

Residential Electricity Prices in New Hampshire – Has Deregulation Delivered?

One of the first bits of energy news I looked at in the New Year was the updated information from the Energy Information Agency (EIA) on annual electricity prices across the US. This information takes a long time to collect and prepare, so it is only current to the end of 2018. Below, I have plotted the historical residential electricity prices for the US and New Hampshire.


There are a few important points to take from this chart.
  • There was a run up in NH electricity prices in the early 1990s followed by a fall off around the start of the millennium, and since 2003 we have seen an almost consistent price increase year after year. Since 1990, retail prices for electricity in the US have increased by 60%, whereas those in NH have increased by 87%.
  • In 2018, electricity prices in NH were 62% higher than the national average. This is the largest difference since the mid-1990s.
In NH, we (and I include myself) spend a lot of time wringing our hands and bemoaning our excessive electrical rates, which are the  6th highest in the US: these grumbles are certainly supported by the data in the chart above.

As high as our electrical charges are, we need to appreciate that electrical rates are only one component of our electrical bills. The other important piece is how much electricity we use. I used the same data source and calculated the average monthly electricity consumption for each household in NH and the US for the same time period. The data are plotted below. I was impressed to note that the average NH electrical consumption has hovered around 600 kWh/month for the last 28 years, whereas the average consumption for the US has increased from 800 to 900 kWh/month.


Combining average monthly consumption and the retail electricity rates (via multiplication) yields the result that in 2018 the average NH electrical bill was $122/month vs. $118 for the US. That is a substantially smaller difference than I expected and has made me a little less fretful about electricity prices in NH. Yes, they are among the highest in the US, but our Yankee frugality combined with our lower dependence on electrical heating and air conditioning, as well as investments in energy efficiency, have led us to electrical bills that are very much on a par with the average for the US.

There is another way to analyze these numbers. I took the monthly bills, annualized them, and calculated them as a percent of the average annual household income, which I assembled from US Census data. For NH, the number in 2018 is 1.7%, which is down from 2.3% in 1990. The equivalent average numbers for the US have risen from 1.6% to 2.2% over the 1990–2018 time period. This indicates that, as a percent of household income, electrical bills in NH are lower than the US average.

All things considered, I think paying 1.7% of our income for reliable electricity supply that is there at a click of a switch is a small price to pay. However, this does not mean that we should not be concerned about electricity costs in NH. We should. My calculations use an average household income of $81,000 for NH. If you are earning substantially less than that amount, your costs for electricity can very quickly balloon to over 5% of your income and, if you are watching your pennies, every rate increase has a significant impact.

Whenever I look at historical electrical rates, I think about the impact of deregulation, which started in 1997 in NH and was only recently completed with the final sale of Eversource’s generating assets in 2018. As I have written in previous blog posts, deregulation required that electrical utilities get out of the electricity-generating business, but left them with the transmission and distribution monopolies in their service area. As a result, NH ratepayers now have the opportunity to purchase power from competitive suppliers or from their utilities who have to go into the open market to procure that electricity from independent generators.

The whole point of deregulation was to remove the monopoly of the utility and to bring competition into the electricity supply business and that prices would fall as a result. After 20+ years of deregulation, the results for NH have been a bit of a mixed bag. Yes, the large industrial and commercial enterprises in the state have benefited and, as individual rate payers, we now can choose who we buy electricity from, but, as the previous chart showed, it has certainly not brought down residential electricity prices.

In the Energy and Sustainability courses I teach at Franklin Pierce University, my students and I spend a fair amount of time debating the success of deregulation efforts in the US. There are now 17 states that have some form of electricity deregulation and it is hard to point at any fabulous success stories, whereas some stunning disasters, such as California’s attempts at deregulation and the subsequent bankruptcy of some of its largest utilities, have ensued.

I am always interested in good ideas and novel experiments: my view of deregulation is that it has been both of these. However, what is more important is looking back and understanding if these experiments and ideas have worked and, if they haven’t, perhaps we should consider trying something else.

With that said, I followed the approach of the folks from the American Public Power Association, who took a look at residential electrical rates from 1997, which is considered the first official year of electricity deregulation in the US . I looked at data for NH, and the US (this includes data from the chart above) as well as for the deregulated states (which include NH, MA, ME,  RI, CT, NY, NJ, DE, IL,CA, MI, OH, TX, DC, MT, MD). This is presented in the chart below, along with some data in the accompanying table.

We can observe that, in all cases, there have been overall price escalations, but for NH and the other deregulated states, the increases started from a higher base. The challenge with this data is how do we compare the relative increases – do we do this on the basis of the overall increase, the average annual increase, or the compounded annual growth rate, and, most importantly, what do we use as our time frame and starting date? In the table, I present data for the overall nominal and percent increases from a starting point to 2018. I chose three start dates for the comparisons: the first was 1997 – the date when deregulation became law in NH; the second was 2002, the year of the lowest NH electricity prices since deregulation; and 2012, which is when, based on the data, residential customer choice really kicked in at Eversource, the largest utility in NH.

In the first case, the data show that overall percent increases for electricity in NH and the deregulated states from 1997 were lower than those for the regulated states and the US overall because they started from a higher base. However if we use 2002 or 2012 as the base year, the increases for NH are substantially greater than for the US, the deregulated states, and the regulated states.

These analyses and comparisons are further complicated because deregulation only deals with the electricity-supply portion of the overall electricity price, which is about 60% of our overall electrical rates. There are a lot of factors baked into our electricity prices. There is the cost of electricity, which includes wholesale costs, long-term supply contracts, as well as the necessity to source renewable energy required by the renewable portfolio standard. And then there are transmission, distribution costs, systems benefit charges, service fees, and penalties for past mistakes and regulatory changes (in the form of stranded costs) and well as built-in profits for the utilities.

At this time, there is little evidence that residential rate payers in NH have benefited from deregulation. Although the large industrial and commercial users in the state have profited from the changes, I am hard pressed to make the case that deregulation has been good for residential rate payers. Yes, we can now choose to buy electricity from suppliers that source from renewable power generators (at a higher cost) and some might propose that deregulation had an impact by inhibiting larger prices increases. This is a weak argument to make because lower wholesale prices, driven by lower natural gas prices, have had a larger mitigating effect on price increases than deregulation.

Further evidence of the small impact that deregulation has had on residential rate payers in NH is the observation that only ~20% of NH residences have elected to go with a competitive provider. Moreover my recent review of electricity offerings from competitive suppliers shows that, in most cases, the default rates offered by the local utilities rates are, at this time, mostly lower than the competitive suppliers operating in the state. There are exceptions, but the differences are generally small and generally do not last over time. Not only are there concerns that deregulation has not benefited rate payers, but recent studies from other states have shown that residential rate payers have been penalized for participating in the competitive electricity supply market and that low-income customers suffer the bulk of the harm.

Deregulation seemed like a good idea at the time: we have tried it out but it has not worked out the way we thought it would. There have been benefits, but, in this case, competition and the “invisible hand” of the market have not led to lower residential rates. I think it is now time for us to take a long hard look at this experiment and to figure out if there is a better way. NH was the first state to the deregulation party and we should be the first to take a deep data-driven look at alternatives. I will be taking a closer look at this issue in future blogs. In the meantime, do your bit and turn off the lights when you leave the room.

Mike Mooiman
Franklin Pierce University
mooimanm@franklinpierce.edu
Click on this link to receive email notifications for Energy in New Hampshire updates

PS: For those of you interested in looking at competitive electricity rates, the NH Public Utilities Commission now publishes information about the competitive suppliers and their rates on the PUC website at the following link. https://www.puc.nh.gov/ceps/shop.aspx

Wednesday, January 25, 2017

Saving Grace* - Energy Efficiency in New Hampshire – Part 2

In my last post, I looked at the big picture of energy supply and consumption in New Hampshire, as well as some gross measures of energy efficiency (EE), viz., energy intensity and energy use per capita. The data indicated that we are making progress, but that we have a long, long way to go before we can consider ourselves energy efficient. In this post, I take a look at NH’s EE ranking and some important policy developments that will help promote EE in the state.  

The American Council on an Energy Efficient Economy (ACEEE) produces an annual scorecard that ranks the states on their EE initiatives and progress. The map below shows the state rankings in the most recent scorecard report. The ranking is done by grading each state’s utility EE programs, transportation initiatives, building energy codes, state government initiatives, and combined heat and power programs. NH’s ranking is in the midrange at # 21: we are surrounded by New England states with much better rankings, including Massachusetts, which, along with California, hold the number 1 spot.  


A closer look at the NH’s scorecard is enlightening. The figure below shows specific data regarding various scorecard components compared with those of NH’s immediate neighbors.


As you can see, NH’s scores were run-of-the-mill in the areas of utility programs, building codes, and state initiatives, and poor in transportation, appliance, and combined heat and power initiatives. The scorecard report does note that the state took a big step forward by approving new energy-savings targets for 2018 to 2020, but also remarked that NH could improve considerably in the transportation and combined heat and power sectors. Our neighbors are clearly doing more in almost all categories.

When it comes to EE, it is my view that there are three main drivers, as indicated below.


The first, and most important, are government-mandated EE programs. These include building codes, appliance efficiency standards, and fuel-economy standards for motor vehicles. These are often Federal standards, but sometimes state-specific requirements may exceed or fill in for a lack of Federal standards. Producers of the goods and services affected by such mandates are required by law to ensure that their products meet these requirements; we, as consumers, indirectly participate in EE by purchasing these goods.

The other type of EE initiatives are those in which we voluntarily participate by making non-mandated but important EE decisions; for example, the replacement of an incandescent or CFL lightbulb with a more expensive but more energy-efficient LED bulb.

The third driver for EE is energy prices. We are very basic creatures and respond to financial incentives, so if energy prices are high, be it electricity, natural gas, or gasoline, we generally take active measures to reduce our energy expenditure by driving less, buying more fuel-efficient vehicles, or putting on a sweater and turning down the thermostat. One might argue that high energy prices are just a driver of our voluntary actions; however, I see them as different because there is often an altruistic/it’s good for the planet/right-thing-to-do component to voluntary action. And if you can save boatloads of money by doing the right thing for the planet, more power to you. (Or perhaps that should be less power to you?)

For the remainder of this post, I review utility-run EE programs in NH. These are a combination of mandated and voluntary actions. The utilities are mandated to offer them, but we, as home or business owners, voluntarily participate in them, but, in doing so, we also have to open our wallets to pay for our part of these investments.

Since 2002, NH has had a formal utility-run program to promote EE investments in NH, known as the Core Energy Efficiency Program. This is a New Hampshire Public Utility Commission (NHPUC)-mandated program with required participation by the electrical and natural gas utilities. The utilities collaborate in their efforts to provide savings, information, incentives, and assistance in the implementation of EE investments to their ratepayers, which include municipalities, homeowners, and industrial and commercial operations. Information about the program is reported on the NHSaves website, which is a good place to start looking for information about energy savings and EE if you are a NH ratepayer. The program is directed at both the electrical and natural gas utilities and requires savings in both.

The NHSaves program has many features and offers a lot of services to realize energy savings. Quoting directly from the 2017 New Hampshire Statewide Energy Efficiency Plan, the elements of the program include:

  • “Working with Home Energy Raters and building contractors, to incent the construction of highly efficient homes that use 15-30 percent less energy than a standard new home. 
  •  Incentivizing insulation, air-sealing and other weatherization measures performed by qualified private contractors to reduce a homeowner’s heating fuel use by more than 15 percent on average.
  • Providing insulation, air-sealing and other weatherization measures to low-income families, saving them hundreds of dollars per year on energy costs, though a collaboration with the NH Office of Energy and Planning’s Weatherization Assistance Program and New Hampshire’s six Community Action Agencies.
  • Partnering with over 100 New Hampshire appliance retailers and suppliers across the state to help customers purchase highly efficient appliances such as refrigerators, clothes washers and room air conditioners, saving 10-20 percent of the energy they would have used if they had purchased standard efficiency models.
  •  Partnering with over 100 lighting retailers and suppliers across the state to reduce the barriers for New Hampshire customers to purchase energy efficient lighting measures that can save between $30 to $80 over the lifetime of a single product.
  • Working with qualified private contractors to help businesses and non-profits identify and install more efficient lighting, controls, motors, HVAC equipment, air compressors and industrial process equipment. 
  • Focusing on municipalities to help save energy in public buildings, reducing overall costs to taxpayers and making public spaces a model for efficiency improvements.”

To date, the goals of the NH program have been modest and the annual energy savings have been small—of the order of 0.5% of NH total energy consumption. Our neighboring states have been more aggressive in their savings; for example, in 2015, RI, MA, VT, and ME had savings of 2.91%, 3.74%, 2.01%, and 1.53% of their 2015 retail sales, respectively.

Even though NH’s annual savings have been relatively small, these small savings, year on year, have accumulated over time. It has been estimated that, since the start of the Core program, customers have saved over $1.9 billion and reduced electricity consumption by 12 billion kWh and natural gas use by 24.5 million MMBtus (million BTUs). The Core program, by most measures, has been a successful one.

These accumulated savings are great, but there is a cost for the program that NH ratepayers fund. The 2016 budget was ~$24 million for the electrical EE programs and ~$7 million for the gas programs. The electrical component has been funded by part of the Systems Benefit Charge (SBC) paid by each electrical ratepayer (in 2017, the  EE portion will be 0.198 cents/kWh of the 0..354 cents/kWh SBC charge averaged across the four utilities), money from the Regional Greenhouse Gas Initiative (RGGI) auctions that are distributed to the NE states, and from the ISO-NE capacity market. The natural gas savings program has been funded through the local distribution adjustment charge (LDAC) paid by natural gas users. Typically, the split in funding for the electrical program has been 70% from SBC funds, 19% from RGGI, 10% from the forward capacity market, and  1% from carryover and interest, whereas the natural gas savings program is funded completely from the LDAC charge.

It is important to appreciate that all ratepayers pay their share towards the program, but only those that elect to participate benefit directly and reap the big savings. To actively benefit from this program and reap the rewards requires you, as the ratepayer, to make an upfront EE investment. The amount that you have to pay depends on your utility, class of service, and particular type of EE investment. Even though there is a requirement for an upfront investment, the utility-run EE programs have been popular: there have been waiting lists and money to fund EE investments has run out before the end of each year.

Even if you don’t participate directly, you, along with other non-participating ratepayers, benefit indirectly because reduced energy consumption, regardless where it comes from, benefits us all. It improves the resiliency of our energy-delivery systems because less energy has to be sourced, it keeps our costs down because fewer power plants have to be built, our resources last longer, less pollution results, greenhouse gas emissions are reduced, local jobs are created, and, as noted in my previous post, there is a cascade of other benefits that results from EE investments.

The Core program is well run and carefully administered, and a great deal of effort is expended in evaluating its effectiveness. It is overseen by the NHPUC, but is run by the electrical and natural gas utility companies that are required to submit a joint annual plan and budget. The joint administration and shared marketing resources through the NHSaves program ensures consistency and best practice implementation across all utilities. Each utility is required to provide quarterly and annual reports and is subject to annual financial audits and independent certification of savings.   The program is a serious endeavor and is continually reviewed. THE NHPUC has over 130 reports evaluating the effectiveness of EE programs in NH and NE. I consider this to be an important and well-run, documented, audited, and verified initiative.

As part of their administration of the EE program, the utilities carefully vet the projects that are considered and each undergoes a thorough cost-effective screening. Each program is required to have a benefit-to-cost ratio above one. The costs and benefits are over the lifetime of the project (which vary depending on the nature of the project); costs include both the utility and ratepayer contributions. The specific benefit:cost goals laid out in the 2017 plan are shown in the table  below.
  
As mentioned, the utilities report annually on their EE programs, recording what was spent and what the benefits were. I have summarized some key findings from the 2015 reports in the table and bullet points below:


  • Eversource, with the largest number of customers in NH, spent the most on EE programs.
  • There are variations from utility to utility, but the end users (homeowners, commercial, industrial and municipal) are paying, on average, 45% of the costs of EE investment; the utility pays the other 55% out of their funds allocated for EE.
  • Homeowners are paying, on average, 37% of their EE investments.
  • The lifetime benefit/cost ratio is an average of 2.2, which means that, for every $ invested in EE, NH reaps over $2 in benefits in terms of energy savings.

Overall, the cost of EE investments in NH through the Core program has been estimated to be 3.7 cents/kWh. If we had spent this money on just buying more electricity, we would have paid the retail price of about 16 cents/kWh. The natural gas savings are similar: $0.336/therm for EE vs. $0.81/therm for purchase. In short, investing in EE is a bargain.

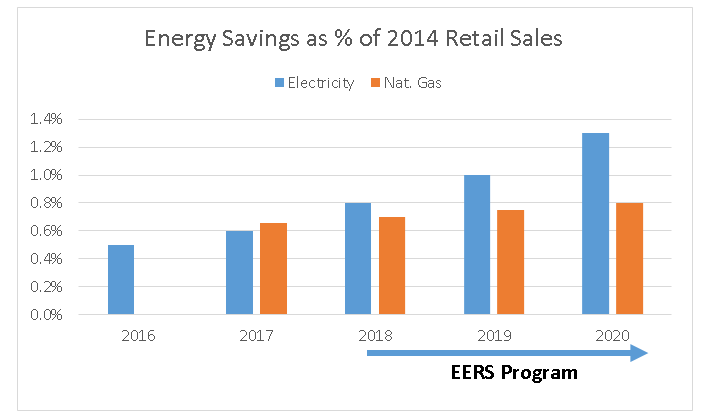
The challenge with the Core program is that, while it has been popular, funding has been limited and a lot of deserving EE projects have not yet been implemented. To support more EE savings and meet the objectives of  NH’s 10-year Energy Strategy, the NHPUC  has recently approved a new statewide utility-run EE policy, known as the Energy Efficiency Resource Standard (EERS). This program boosts the annual goals for energy efficiency and increases funding available for EE investments. It kicks in at the start of 2018 and requires utilities to increase their annual energy savings.  The EERS program was developed with significant stakeholder involvement, ranging from environmental lobbying groups, utilities, state representation, community action groups, and other energy-related non-profits. The program will be overseen by NHPUC with input from stakeholders and will be jointly administered by the utilities, as with the Core program.

The annual goals for the new EERS program, and how they compare with the recent Core program goals, are shown in the figure below.

It is good to see the annual savings increase: over the next four years (2017 to 2020), there will be a cumulative savings of 3.1% of electricity and 2.25% of natural gas (compared with 2014 consumption). But, again, I need to note that, compared with our neighbors, these goals are rather humble: the average annual electrical savings increases are 2.1% for Vermont, 2.9% for Massachusetts, 2.4% for Maine, and 2.6% for Rhode Island. 

The EERS plan also has the following features:
  • Instead of the two-year planning and implementation cycles used in the Core program, the EERS program will use a three-year cycle.
  • Funding for EE investments will more than double over the next few years. In 2016, the budget for EE investments was $31 million; in 2020, it proposed to be $74 million.
  • The money for these increased EE investments will come from an increase in the SBC and LDAC components of the utility bill. The average SBC and LDAC in 2017 will be 0..354 cents/kWh and 4.95 cents/therm, increasing to 0.821 cents/kWh and 6.91 cents/therm in 2020, respectively. This will result in a $2.70 monthly increase in the electrical bill for a ratepayer using 600 kWh per month. Overall, the EERS program will contribute to a 2 to 3% increase  in NH utility bills from 2017 to 2020.
  • To compensate utilities for the lower energy sales and lost revenue associated with EE, a lost revenue adjustment mechanism (LRAM) will be implemented. This is new and is built into the SBC rate increase.
  • As with the Core program, there are built-in performance incentives to encourage utilities to make these investments. Basically, the utilities will earn a bonus for achieving above-budget energy savings.
  • The EESE Board, which is a multi-stakeholder committee that works with the NHPUC to promote energy efficiency and sustainable energy in the state, will serve as a review and advisory council.
  • Evaluation, monitoring, and verification will be carried out by independent consultants.
  • The low-income assistance portion of the program will increase from 15.5% to 17% of the total EE budget for the first three years.

There are, of course, objections to the EERS program. It will increase the bills of all ratepayers across the state, but big savings only accrue to those who participate and have the funds to foot their part of the investment. However, bear in mind that if your neighbor makes a big investment in EE and significantly reduces her monthly cost, you indirectly benefit from improved energy system resiliency, lower long-term energy costs, less pollution, etc. This is similar to the benefits that an SUV driver might derive from drivers of EE vehicles: those drivers of EE vehicles extend the lifetime of oil resources, reduce pollution, and keep oil prices down.  Ultimately, it is your choice whether to pour your dollars into your gas tank or into inefficient energy use in your home, but keep in mind that you do benefit from the EE activities of others.
  
Should you find yourself agitated by the increase in utility rates associated with the EERS program, I encourage you to take direct action that undo that increase. Go through your home and find three old style incandescent ightbulbs and change them to LED bulbs (which can be purchased for $2/bulb). The annual energy savings from these bulbs (assuming you have changed to  10W LEDs,  burning for 4 hours a day and your average electricity use per month is 600 W) will save you 2.7% of your electricity bill which more than relieves that phased SBC increase.

It must also be appreciated that EE presents a problem to regulated utility companies. They are in business to sell electricity or natural gas and thereby earn a return on their investments to pass on to their investors. (And before you get all self-righteous about money-grabbing investors, look at the companies in your retirement investments: you will mostly likely find some utility companies in your portfolio, making you one of those investors. Utility company shares have proved to be extraordinarily reliable investments with steady returns.) When utilities are obligated to make investments in EE, this reduces the amount of electricity or natural gas they sell, reduces revenue and profits, and limits opportunities to make infrastructure investments on which they can earn a return. Moreover, they have to administer these EE investments, employ staff to run these programs, and incur costs. Generally, the utilities would not be in favor of these programs so they need to be incentivized to participate. This is done by compensating them for the lost sales and costs associated with the EE program, which is built into the SBC or LDAC charges. In essence, the utilities get to sell less of their energy commodity at higher prices.

This post has covered NH’s middle-ranking EE. We are way behind our New England neighbors in EE, but the saving grace* is that that NH is in the process of transitioning from the Core to the EERS program, which is an important step forward.  Required annual energy savings will increase and EE investment budgets will more than double. This will have utility-cost implications because NH ratepayers will see a 2 to 3% increase in their utility bills over the 2017–2020 period as a result of these changes. However, these are good programs that make a difference and we all benefit and, by our implementing our own simple EE actions, like changing over to LED lightbulbs, we can cancel out the effect of the rate increase. It is a far better idea to make EE investments now that reduce our exploitation of fuel resources and reduce energy infrastructure investments. This will reduce energy cost increases in the future

However, to fully benefit from these programs requires action and investment on our part. This is something that we don’t always do—even when we know it is the right thing. I will discuss this lack of action in my next post. In the meantime, do your bit for energy efficiency and turn off the lights when you leave the room.

Mike Mooiman

Franklin Pierce University
mooimanm@franklinpierce.edu


(*Saving Grace: A fabulous tune with a great driving groove by one of my favorites: Tom Petty. From the Highway Companion album released in 2006. Enjoy Saving Grace.)

Friday, January 2, 2015

It’s Time to Move On* - Competitive Electricity Supply in New Hampshire

In my last few posts, I have been writing about the electrical utilities and their winter rates. In this post, I take a look at the competitive energy suppliers in New Hampshire.

Electricity consumers in NH have a choice. They can go out and pick their electricity supplier or they can simply leave it to their utility to source and supply their electricity under the so-called default electrical service rate (see Gonna Take You Higher post).The move to competitive electricity supply has gone through two waves. In 2006, five years after the onset of electricity deregulation in NH, there was a massive migration of commercial and industrial customers to competitive suppliers. In 2011, there was a second wave of migration, this time by retail customers. Right now, about 50% of the electricity supply in NH is from competitive suppliers. The table below shows data for overall competitive supply for the NH electrical utilities and some information for large commercial and residential customers. It is clear that competitive suppliers provide most of the electricity for large commercial customers. In the case of PSNH, this is a stunning 96%, which, as I have noted before, leaves the residential customers responsible for picking up most of the costs for PSNH’s generating assets.
There are three types of electricity providers in NH. There is the utility itself which the default supplier, and then there are competitive suppliers and aggregators. At last count, there were 25 competitive suppliers and 90(!) aggregators.

The competitive suppliers approved to offer electricity supply are listed on the NH Public Utilities Commission (PUC) website. Not all of these companies supply to residential customers: some specialize just in the larger commercial and industrial  customers. Of the 25 competitive suppliers, 16 supply to the residential market but not all suppliers are active in all utility service areas.

Suppliers actually have to source the electricity and work with the utility to get it delivered to your home. Aggregators adopt a different approach. They will do the shopping for you and will go out to competitive suppliers and find a good rate for you. Once they do this, and you agree to the terms, they will then switch you to the competitive supplier. Aggregators tend to specialize in specific markets, e.g. small commercial customers or geographic areas. 

The table below shows which suppliers are active in which electrical utility service areas.

Some of you may recall the drama caused last year by one of the competitive suppliers, Power New England (PNE) and its aggregator, Resident Power, when PNE was suspended by ISO-NE for cash-flow problems created by high electricity rates in the winter of 2013. With the suspension of PNE, about 7000 customers had to be transferred back to the default service of PSNH over a weekend.

There are some key points that everyone should know about competitive suppliers:

  • Competitive suppliers are not regulated. Their prices and terms are not subjected to the same scrutiny as those provided by the utilities through their default service rates.
  • Do your homework. Look at the rates and request the terms and conditions.
  • Competitive suppliers offer fixed and variable prices.
  • There can be costs for switching.
  • Competitive suppliers can shunt you back to the service utility at their discretion.
  • The utility is always there as a backstop, in case your competitive supplier cannot supply electricity or goes under.

The NH PUC provides helpful information on competitive suppliers, including a useful list of FAQs and, particularly, a valuable list of questions to ask suppliers.

One of the challenges we face as consumers is that sometimes there is simply too much choice. It is well known that, in the face of too much choice, we often pick the easiest option – which is usually the default option. How many of us really have the time to call those 16 competitive suppliers and the compare their rates and terms?

This is where information-aggregation tools, such as Kayak for airline prices, are so useful. In one simple search, you can look at most airline rates on one page. One would hope that a similar tool would be available for competitive electrical supply, but, unfortunately, similar tools for NH electricity shoppers are not as helpful.

ShopEnergyPlans.com is one such site, but only a limited number of suppliers post their rates on the website. Recent examination of the website showed only three vendors in the PSNH service area. I chatted to Andre Ramirez, one of the co-founders of ShopEnergyPlans.com, about this. Although he has contacted most of the NH suppliers, there is a reluctance for many suppliers to openly exhibit their rates on an aggregator website. On reflection, I think this is understandable, particularly for a price-sensitive commodity, such as electricity, where customer loyalty is very price-dependent. It is the lowest price that will command the most interest, so many vendors choose not to post when their prices are higher.

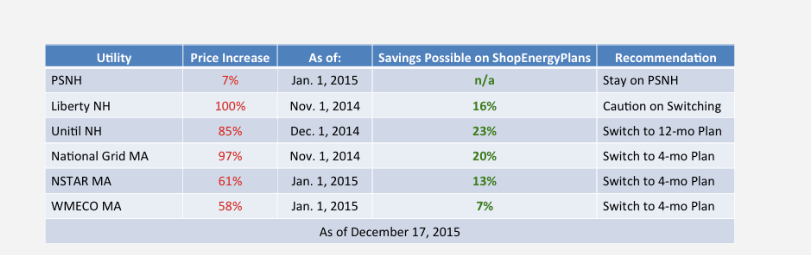
In my chat with Andre, I did learn of a new feature offered by ShopEnergyPlans called PlanTracker. This is a notification tool that sends out emails with recommendations for actions to take regarding your electricity supplier. Having entered Manchester as the zip code for my energy service provider, this morning I received an email recommending that I stay with PSNH for the time being. A list of their recent recommendations for New Hampshire and Massachusetts are tabulated below. I think PlanTracker is a useful service and is a great way to keep on top of changes.


Although I understand why vendors may not want to post their information on an information aggregation website, such as ShopEnergyPlans, I still wanted to know what rates these other vendors were offering, so I spent a morning visiting the websites of all competitive suppliers for residential electricity in the NH service areas and collected the information in the rather large table below. In the process, I was subjected to an overdose of photographs of outrageously illuminated homes or of happy families in warm (and uncluttered) homes, playing on the carpets or looking at their laptops or smart phones, as well as more short videos featuring cute cartoon characters than one person should watch.


The table shows all competitive suppliers servicing the four NH utilities. Orange indicates that the supplier has not registered to supply electricity in that particular service area. Yellow highlights indicate areas where the supplier has registered but is not yet offering service (as indicated by their websites).  The non-highlighted areas, of course, indicate that rates were available on the various websites and I present the lowest rates for particular services. Many of these vendors offer “green,” or renewable energy, options or a blend of renewable and fossil fuel options. I did not consider these, but simply looked for the lowest rates. Here is what I learned from this exercise of cutting through the overgrowth of website based electricity supply marketing in NH.
  • Many vendors offer fixed-period and variable options – variable electricity prices are not posted. It is probably a challenge to keep variable rates updated regularly and this is perhaps not a popular option.
  • For the smaller utilities (NHEC, Liberty, and Unitil), competitive vendors do not seem to have made headway in their service areas and limited choices are available.
  • PSNH has the most competitive suppliers offering prices.
  • There can be a wide range of prices offered by competitors in a service area.
  • Many of the competitive suppliers have cancellation fees associated with their fixed-term contracts, so if you want to jump early, you will end up with some additional costs.
  • Not all suppliers offer contracts across all service periods. Some just offer a vanilla option of a single rate for 12 months.
I am sure I may have been able to gather price information for the vendors with unlisted prices if I called each utility, but that would have taken up even more time. It also serves to make the point that, even though NH has competitive electricity supply, finding and comparing rates is a time-consuming task.  My overall assessment of competitive electricity supply in NH is that we still have a long way to go. I would have thought that competitive suppliers would be falling over themselves in the NH market, that more choices would have been available for residents, and that price information would be more accessible.  

In the deregulation process to date, the companies that have done well are the large competitive suppliers, such as Constellation and TransCanada, that have focused on the large industrial and commercial customers and have won a great deal of this business. The table below, based on Energy Information Agency 2012 data, show that these competitive suppliers are now the second- and fourth-largest electricity suppliers in NH.

These competitors have been very successful at drawing large users of electricity away from the utilities and there is now a slower picking away at residential customers by smaller competitors focused on this market. It always astounds me that more than 50% of PSNH electricity sales are going to competitive suppliers (see the first table in this post), leaving a smaller and smaller base of residential customers picking up the tab for those PSNH plants. Rough calculations show that, if the costs in PSNH’s recent filing are accurate and we assume that 60% of their costs are fixed, and if PSNH supplied electricity to all their customers, then their costs per kWh of electricity could be as much as 30% lower than their present default rate.  

What do we take from this?  This half-hearted and incomplete process of electricity deregulation in NH has hurt PSNH residential rate payers. We understand that it is complicated but the process needs to be completed. It is time to move forward and get the job done. Either pull the plug on deregulation or get it done.

In the words of that great rock and roll sage, Tom Petty*

It’s time to move on, it’s time to get going.
And what lies ahead I have no way of knowing
but under my feet, the grass is growing.
It’s time to move on, it’s time to get going.

Until next time, remember to turn off the lights when you leave the room.
Mike Mooiman
Franklin Pierce University
mooimanm@franklinpierce.edu


(*It’s Time to Move On – A tune from one of my favorite Tom Petty’s albums, Wildflowers. Here is Petty performing the tune live in 1994. It’s Time To Move On)

Thursday, November 13, 2014

The Heart of the Matter* – PSNH and Electricity Price Increases in New Hampshire

In my last post, I presented the table below and made a big deal about the large winter price increases that have been put forward by NH Electrical Co-op, Liberty and Unitil, but did not discuss the surprisingly small increase put forward by PSNH (highlighted in yellow). However, in an earlier post, River’s Gonna Rise, I made the statement that, “…with electricity prices shooting up this winter and with PSNH customers, for the time being at least, somewhat shielded from these increases, this does give one pause for thought and to consider that ownership of generating operations may perhaps have some benefits.” Well, I have been thinking long and hard about this and about PSNH’s relatively low winter rates and, after some research, analysis, charts, and graphs, I have now come to a rather different conclusion. Read on.


For the three-winter period shown in the table above, I have plotted the default electricity rates for the different utilities in the graph below.  Bear in mind that these data are not exactly comparable because they involves slightly different time periods (e.g., the NH Electric Coop (NHEC) winter rate runs from October to March, whereas that for PSNH runs from January to June), but it is a convenient way to view the data. Over this three-year period, PSNH rates were generally higher than those of the other utilities except for this upcoming winter, however the other utilities tend to show larger fluctuations from season to season, which PSNH  does not.


Because the other utilities no longer have generating operations, they purchase electricity from the wholesale markets or (in the case of NHEC) directly from generators, as shown in the figure below (excerpted from my last post). As a result, the other utilities are more subject to the ups and downs of the wholesale electricity markets.


However, PSNH is still an integrated utility – it owns its own generating assets – and, as a result, generates a lot of its own electricity. The electricity supply picture for PSNH is therefore somewhat different, as shown in the following figure, where PSNH has a large supply of electricity generated from its own operations (shown in grey).


I have written about PSNH’s generating operation in several posts, including a recent overview of their hydro assets in River’s Gonna Rise and the possible sale of their generating assets in Options. PSNH has approximately 1200 MW of generating assets, as shown below.


The problem for PSNH is that their main assets are the old coal-fired Merrimack and Schiller plants and the relatively inefficient dual-fuel plant in Newington. In a market with low natural gas prices and very efficient dual-cycle natural gas plants, these older PSNH plants are generally non-competitive and there is often little call for the expensive power they generate.

To understand just how much electricity PSNH produces from its own operations, I took a close look at the data presented in PSNH’s latest filing for winter electricity rates. The filing included electricity supply numbers for the whole of 2014, which were a combination of actual year-to-date and forecast numbers.  I used this data to prepare the Sankey diagram below. (For more on Sankey diagrams, see Another View of Statewide Energy Flows in New Hampshire.)


The origin of PSNH’s 2014 electricity supply is shown on the left in gigawatt hours (GWh). The total amount supplied is 4901 GWh. The flows in grey originate from PSNH’s own generation operations, whereas green flows are from contracted suppliers or wholesale market purchases. The right side shows what happens to the electricity generated and sourced by PSNH: the bulk of it, 79%, is sold directly to PSNH customers; transmission and distribution losses are about 6%; and the remaining 15% is sold into the wholesale markets - mainly during the cold winter months.

The chart below shows the same data on a month-by- month basis, calculated as the percentage of PSNH’s total output generated by its own operations. These 2014 numbers are a combination of actual (blue) and forecast data (orange). The chart clearly shows that the PSNH operations – largely the coal-fired Merrimack plant – really ramp up in the cold winter months and are responsible for the majority of PSNH output during these times.  In the warm summer months, when natural gas is cheap and readily available, it is not financially prudent to run the coal-fired operations. Instead, it is cheaper for PSNH to buy natural gas-generated electricity from the wholesale markets. At these times, the bulk of PSNH supply comes from contracted or wholesale market purchases. (That little blip in July comes from supplying electricity for our summer air-conditioning needs.)  The final column, in red, shows that the amount of electricity that PSNH will generate from its own operations this year is projected to be right around 50%.


In the Sankey diagram above, I have included the costs of the electricity purchased by PSNH. Aggregating these costs and calculating a weighted average, I determine that that average cost of purchased energy is 5.4 c/kWh. If this purchased energy is 50% of PSNH output and PSNH is selling electricity at 9.5 c/kWh to its customers, it takes only simple algebra to determine that the all-in cost associated with PSNH-generated electricity is 13.6 c/kWh (0.5 x 5.4 + 0.5 x 13.6 = 9.5). And therein lies the rub: At present utilization rates and with low electricity prices in the summer, the PSNH generation facilities are very expensive to run. The high costs associated with its coal-fired operations weigh heavily on the rates paid by PSNH customers and explains why, more often than not, PSNH rates are higher those of the other NH utilities.

I realize that this calculation represents a gross simplification of a complex matter and it allocates the burden of all government-mandated electricity programs, like RPS and RGGI, to the generating assets only. Even so, the bulk of the costs originate from the assets themselves so I am comfortable with the simplification. This straightforward calculation, when applied to 2015 projections, clearly demonstrates that PSNH low winter rates for 2015 are not as a consequence of its own generating assets. Instead, they are a direct result of its portfolio of supply arrangements from wholesale market purchases and power-purchase agreements from wood-burning plants, including the new Burgess plant in Berlin, the wind farm in Lempster, and other generators.  So my earlier statement that, “…with electricity prices shooting up this winter and with PSNH customers, for the time being at least, somewhat shielded from these increases, this does give one pause for thought and to consider that ownership of generating operations may perhaps have some benefits,” does, in retrospect, not appear to have been well founded, at least from a electricity rate point of view.

This calculation also underscores the decision that lawmakers and regulators in NH are wrestling with at this time: Is it in the best interest of PSNH customers to complete the process of deregulation and compel PSNH to sell its generating assets?  If this happens, PSNH will be like the other utilities in NH and will need to source 100% of its electricity from the wholesale markets in New England or directly from generators through long- and short-term contracts. The next (and, I think, the most important) question is: Can this be done for less than 13.6 c/kWh once those generating assets are sold?

If PSNH has to source all its electricity from the wholesale market, they could run into a problem similar to that discussed in my last post, where, like Liberty and Unitil, PSNH could end up buying right into those winter peaks created by natural gas shortages. In my  last post I was somewhat critical of the short-term “next six month” approach that regulations compel Liberty and Unitil to use to source electricity for their customers. I suggested that a portfolio of different sources, as well as long- and short-term supply, be used. As it turns out, the regulators are ahead of me on this one:  the NH Public Utilities Commission (NH PUC) recently issued Order 25,732 to review the sourcing of electricity by Unitil and Liberty. It is very likely that any changes in sourcing approaches would apply to PSNH after the sale of its assets, so it will be interesting to follow developments in this area. 

It is important to note that this is not the whole story. If PSNH is mandated to sell their generating assets, they will − and correctly, I might add − expect to be compensated for the difference between the book value of those assets and what they will raise from their sale. All indications are that this difference, known as stranded costs and discussed in Options, will be substantial.  These stranded costs will come out of the pockets of PSNH customers. The NH regulators at the NH PUC are presently trying to determine how large this amount will be.

In the equation

Stranded costs = Book value – Sale value,

there are obviously two components, both of which are being scrutinized and debated at this time.

As I noted previously, the generating assets are listed on the PSNH financial statements at $ 1.1 billion but with a net depreciated value, or book value, of $ 660 million. This $660 million value includes the $ 422 million recently spent on the scrubber that was installed at the Merrimack plant to reduce mercury emissions from the burning of coal. The original budget for the scrubber was "not to exceed" $ 250 million, but, by the time it was completed, the price had skyrocketed to $ 422 million. A series of hearings was recently held to determine whether it was prudent for PSNH to have spent $ 422 million for a scrubber on an aging coal plant, and we are currently waiting for the NH PUC to make a determination on the prudency of this investment. I anticipate that PSNH will file an objection to the determination and we can then expect the battle to play out in the NH courts.

The second component of the stranded cost equation, the sale value of PSNH generating assets, is also being analyzed. Consultant reports have been commissioned, blogs have been written, and one thing is clear: in this low-cost natural gas market, the coal-fired assets of PSNH have relatively little value. Interestingly, the crown jewels in the PSNH generating portfolio are their hydro assets, about which I have recently written.

In the end − after all the consultant reports, hearings, determinations, and court battles − I believe the book value will be decreased and the sale value will erode, which is still going to leave PSNH ratepayers on the hook for those stranded costs. In Walking on the Wild Side, I indicate these stranded costs may be of the order of 0.5 c/kWh. This has been borne out in a recent status report issued by the NH PUC. This is an important number, but of far less importance than the numbers that will come from answering this one very important question:  Once the PSNH assets are sold, can PSNH reliably, consistently, and over the long term, source electricity at a lower cost than that incurred by their generating assets? This is the heart of the matter* and one that PSNH, ratepayers, legislators, regulators, and courts in NH will be struggling with over the next few years.

This post has covered a lot of ground, so, to wrap it up, let me leave you with the following takeaways:

  • PSNH rates are low this winter but this is not a consequence of owning their generating assets. Instead, it is a result of their low cost purchases through a portfolio of long-term power purchase agreements and wholesale market purchases.
  • The PSNH generating assets have value in cold winter months when natural gas is expensive. As natural gas supply to the region improves over the next few year, this will become less of an issue and the value of coal-fired operations will diminish even further.
  • Scrubber prudency reviews are an important step in moving PSNH to divest its generating assets but, in the big picture, I do not anticipate that this will have a significant effect on the electricity rates that PSNH rate payers will end up paying.
  • More important will be the rates at which PSNH can procure all its electricity from the wholesale markets and whether they will be able to adopt a portfolio approach to sourcing this electricity.
Until next time, remember to turn off the lights when you leave the room.

Mike Mooiman
Franklin Pierce University
mooimanm@franklinpierce.edu


(*The Heart of the Matter – The very moving song from Don Henley’s album The End of Innocence. I really like Henley’s version but it has been very well covered by India Arie. Here are both - you decide which you like best.  Don Henley or India Arie)