Showing posts with label Electricity Generation. Show all posts

Tuesday, September 5, 2017

Solar Power in NH – Part 3 – Ranking NH’s Solar

This is my third installment dealing with solar power in NH. In the first two posts, I provided some basic concepts about solar power, as well as information about NH solar potential and the large solar farm in Peterborough. As I drive around New England, I see solar installations popping up everywhere, especially in Massachusetts and Vermont. Rhode Island recently passed new laws that will continue to support solar in a big way so I thought it would be useful to do a comparison between the various New England states to see how New Hampshire stacks up.
The first information I sought out was how much installed solar each state has. There are several sources for this information, which have different degrees of reliability, ease and cost of accessibility, and different bases for the rankings. Direct comparison of the various sources is complicated by the different ways of rating the power outputs of solar plants. As explained in my previous post, solar photovoltaic (PV) installations produce direct current (DC) electricity and the rating of solar PV operations is often given as the combined DC output capacity, in kilowatts (kW) or megawatts (MW) DC, of the panels under the standard test conditions of 1000 W/m2 irradiation and temperature of 25oC – conditions known as one peak sun (see an earlier post for an explanation of irradiation and the peak sun hour concept). To feed electricity into the grid, the DC electricity needs to be converted into alternating current (AC) through a device called an inverter. During this conversion, there are losses through the electrical system and wiring. These losses are typically of the order of 5 to 10%, so the peak AC output of a solar system, in in kW or MW AC, can vary from 90 to 95% of the DC rating. However, there are also performance losses due to dust on panels, degradation of the panels over time, and elevated temperatures. In my calculations, I typically assume that the peak output of AC electricity from a solar system is about 80% of its DC rating.
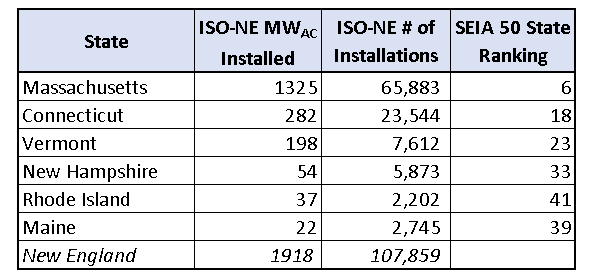
In searching for installed solar capacity information, the most useful I found was the 2016 data from ISO-NE, which is included in the table below, along with the 50 state ranking carried out by the Solar Energy Industries Association (SEIA). I have also included a chart from the ISO-NE Final 2017 Forecast that shows the growth in New England PV installations since December 2013. The ISO-NE data (reported in MWAC) shows that Massachusetts is clearly on top of the New England installed solar rankings, followed by Connecticut and Vermont. Massachusetts is also ranked #7 out of the 50 states in installed solar capacity. California, as one would expect, is ranked #1. In the 50-state ranking, NH is presently in 33rd position.


Source: ISO-NE

Even though Vermont’s installed solar capacity is a small fraction of that of Massachusetts, I was still impressed at how much solar they have installed, so I calculated the installed solar capacity on a per-person basis and generated the chart below. In this ranking, Vermont rises to the top, with installed solar capacity of 318 W AC per capita. To put this into perspective, this means that Vermont has installed the equivalent of more than one solar panel for each person in the state (modern solar panels have a DC rating of 300 W and an AC output rating of ~240 W (after losses)). This is a little lower than the California figure of ~370 WAC, but I’m still impressed.

 Source: ISO-NE and  Census.gov

In terms of installed solar, NH is very much at the back of the pack, but there are other solar ranking systems out there. I am a fan of the state rankings carried out by the folks at Solar Power Rocks. They order states on the basis of regulations, incentives, investment returns, and cost of electricity (among other factors that are supportive of solar power). In their ranking, which I have shared below, NH places fairly high, coming in at #10. The other New England states, MA, RI, VT and CT, also appear in the top 10, while Maine is found in 23rd position.
The specific scorecard for NH is reproduced below: it is clear that with a “B” grading, NH has a lot going for it in terms of support for solar power. The factors in NH’s favor include:
  • High electricity prices;
  • Net metering;
  • The Federal solar tax credit – presently 30% of the cost for installing a PV system;
  • Production credits through the sale of renewable energy credits;
  • State rebates on the costs for installing solar.
There has been a fair amount of news recently about the NH state rebates available from the Public Utilities Commission. The program is presently on hold due to its record demand and concerns about sufficient funding. Nevertheless, there is much in favor in terms of installing solar in NH, and we should be taking advantage of this. In my next posts, I will take a close look at how these factors play out in considering whether to install solar on your home in NH. So, until next time, remember to turn off the lights when you leave the room. 
Mike Mooiman
Franklin Pierce University
mooimanm@franklinpierce.edu

Click on this link to receive email notifications for Energy in New Hampshire updates

Tuesday, August 4, 2015

Next Year* - New Hampshire Electricity Price Update

While we are all enjoying the fine summer weather, I thought it would be useful to take a look back at electricity rates for this past winter and to think about what the coming winter might hold for us. Before we get into this topic, however, I need to note that this will be my last blog on New Hampshire energy issues for the next year. I am heading off to Botswana, Southern Africa, as a Fulbright scholar, where I will be studying energy matters in Botswana, with a particular focus on the solar energy field and storage technologies. As you can imagine, the energy issues in a developing country are quite different. Here in NH, we are all used to reliable, inexpensive electricity whereas, in Africa, two-thirds of the population do not even have access to electricity, it can be very expensive, and, when available, it is often not reliable. In NH, we sometimes seem intent on blocking the development of any energy projects, whereas in Africa energy infrastructure development is welcomed, encouraged, and supported. The energy field and the associated issues will be quite different and I am looking forward to learning more. While down in Southern Africa, I will be firing up a new blog, titled Energy in Botswana, so if you are interested in following my energy explorations in this part of the world, drop me an email and I will put you on a notification list. But back to NH energy matters…

In my last blog on electricity rates in NH, Gonna Take You Higher, I noted the following:
  • Wholesale prices (and thus retail prices) for electricity during the 2013/2014 winter increased due to natural gas pipeline constraints.
  • The three deregulated utilities—NH Electric Co-op, Unitil, and Liberty Utilities— substantially increased in their winter default service rates, with price increases ranging from 60 to 75%.
  • PSNH rates only increased by 4% and they ended up with the lowest rates in the state.
  • The increases were due to the fact that Unitil and Liberty Utilities were compelled to lock in electricity prices from the short-term 2014/2015 futures market for electricity where prices had skyrocketed due to the high prices of the 2013/2014 wholesale market.
  • I made the recommendation that the utilities should not be restricted to purchasing their future electricity supply to just six months out and that they be allowed to adopt a portfolio approach of both long- and short-term electricity supply agreements to mitigate the effects of short-term price spikes.

I thought it would be interesting to take a look at what actually happened over the winter and what has happened since then.

As shown in the figure below, wholesale electricity prices did spike over the winter but nowhere near the frequency, duration, or magnitude of the previous winter. Peak prices were even lower than those of the 2012/2013 winter.
Data Source: EIA

Compared with the previous two winters, prices increases this year were moderate and actual wholesale rates were lower than the futures prices at the start of the season. In October 2014, futures prices for the winter peak in January and February were ~18 c/kWh (see Gonna Take You Higher).  In January and February 2015, although the wholesale market prices peaked at ~12 c/kWh for January and 20 c/kWh for February, the daily averages for those months were a lot lower—at 8.7 and 13.7 c/kWh, respectively.

This means that when  the electrical utilities bought electricity on the futures market, it is likely they overpaid relative to actual day-ahead wholesale prices. However, this the essence of hedging (or locking in) the price of a commodity ahead of the time you actually need it:  if actual prices turn out to be lower, you end up overpaying, but, if prices end up higher, you are very pleased. Hedging is just like paying for insurance – you pay a premium to protect yourself: it is not about getting the lowest possible price; rather, it is about reducing risk and avoiding exposure to excessive price increases.

After those very large winter increases, the summer default rates plummeted and the three deregulated utilities ended up with rates lower than that of PSNH, which again had the highest rates in the state. The figure below gives an historical record of the default rates for the four NH electrical utilities.

Data Source: Courtesy of NH PUC

Futures prices for electricity for the upcoming winter are currently pretty low compared with those of years past (see the figure below).  The futures markets indicate prices of the order of 12 c/kWh for the Jan/Feb 2016 winter peak, with further decreases expected in the following winters. These lower futures prices are most likely a reflection of the changes that we are seeing in the New England electricity market. The local electricity supply coordinator, ISO-NE, has worked hard to mitigate the extent and duration of the winter spikes by implementing a winter reliability program in which owners of oil-based generating facilities and liquefied natural gas storage operations are paid to store fuel. This ensures a reliable and predicable backup supply of alternative fuels to generate electricity should there be bottlenecks in the natural gas supply from pipelines. 

Data Source: CME
My predictions for electricity rates for the next few years are that we will continue to see short-term winter spikes due to natural gas pipeline congestion during high demand periods but that these spikes will moderate over time as ISO-NE expands and improves its winter reliability program, as some the natural gas pipeline projects get implemented, and as more Canadian hydro power makes its way down to New England.

Since the deregulation of electricity supply in NH, customers are no longer compelled to purchase their electricity from their default provider. Given the big fluctuations in default energy rates and the availability of competitive suppliers, I thought it would be interesting to look at how customers have responded – are they flocking to competitive suppliers or are they staying with their default utility? I took a look at the customer migration numbers for PSNH – the largest NH utility. The chart below shows data for the past three years. The data in orange show that, from about July 2012, the number of residential customers purchasing their electricity from competitive suppliers started to accelerate, and this trend really kicked in in the first quarter of 2013 when there was big movement of customers to competitive suppliers. The numbers reached a peak at the end of 2013, when approximately 28% of PSNH residential electricity customers were supplied by other companies. Since then, there has been a slow decrease and, presently, some 20% of the electricity supply to residences comes from competitive suppliers. The data in blue, which is for all PSNH customers (including small and large commercial and industrial enterprises), show that, in October 2013, almost 60% of all electricity distributed by PSNH came from competitive supplies. The numbers have fluctuated since then but, this past winter, this number fell below 40%, corresponding to a big migration back to PSNH due to their lower default rates. There is now a slow movement away from PSNH again, as lower summer rates begin to appear attractive to the commercial and industrial enterprises. 

Data Source: NH PUC

Some months ago I wrote about a website called shopenergyplans.com, which allows you to compare electricity costs from competitive suppliers in your service area. At that time, shopenergyplan.com was only presenting information for suppliers who agreed to have their rates posted. Shopenergyplans.com has advanced since then and now provides details for a larger number of competitive suppliers. In my last blog on this topic, I noted that rates for only three competitive suppliers were listed for the Manchester service area. Yesterday, I noted that are now seven different suppliers listed, with 40 different plans, ranging from 1 to 36 months, and including various renewable energy sources. A few weeks ago, shopenergyplans.com notified me of two electricity supply plans from competitive suppliers offering lower rates in the PSNH service area. This website is a good place to start if you are considering looking for a competitive supplier but I caution you to do your research and make sure that you understand the contract terms – remember that there can be costs for switching and the competitive suppliers can shunt you back to the service utility in your area at their discretion.

As I noted at the start, this will be my last blog until I return next year.* If you are interested in following my energy adventures down in Botswana, please drop me a note at my email address below. In the meantime, thank you for your interest in my work. Keep in touch, let me know what is happening in NH while I am away, and remember to turn off the lights when you leave the room.

Mike Mooiman
Franklin Pierce University
mooimanm@franklinpierce.edu


(*Next Year - A very appropriate song by the Foo Fighters featuring the ubiquitous Dave Grohl. Great video too. Enjoy Next Year.

Monday, October 13, 2014

River’s Gonna Rise* - Hydro Power in New Hampshire – Part 3: PSNH Hydro Operations and River Flows

In my last few posts, Down by the Water  and Take Me to the River, I mentioned that my office looks onto the Merrimack River and the upstream Amoskeag hydroelectric operation that has been producing electricity for the past ninety years.  From this view, I often take note of river flows and whether the water is spilling over the top of the dam wall, as in the photograph below. In this post, I discuss the variability of river flows and how hydro plant electricity outputs are very dependent on these. I also look at the capacity factors of the Merrimack River hydro operations and compare them to national averages.


Weather and precipitation are the most important variables in hydro electricity operations because these determine river flow. I dug up some relevant information about Merrimack River flows near my office from the United States Geological Services (USGS). The chart below shows the river flows at the Goffs Falls monitoring point, which is just downstream of the Amoskeag Dam. The jagged blue line shows the data for 2013 and it is surprising how variable the flow is from day to day. The orange dots show the average flowrates over the past 76 years. This historical data shows that river flows generally rise during April to June due to snow melt, reaching flows that are four times the average value, and then drop off considerably during the dry August to October period, to about one quarter of the average. Interestingly, the summer of 2013 was a wet one, as indicated by the higher-than-average river flows during this period.

Source: USGS

A simple relationship dictates the generating capacity of a hydro operation:

Power = Constant x Flow x Height

In an operation such as Amoskeag, the height (or head) is essentially fixed because this is a constant-level run-of-river operation. However, since Merrimack River flows do vary, I took a look at the 2013 monthly river flows and compared them to monthly electricity production (measured in MWh) for the two larger operations on the Merrimack River. These are plotted in the figure below on the left, with river flows in the green bars, and Amoskeag and Garvin Falls electricity generation in blue and red, respectively.


Data Source: USGS and EIA

As expected, high river flows, particularly during the April snowmelt or the wet July of last year, generated higher amounts of electricity.  Low river flows, such as in the dry months of August to October, were associated with lower generation rates. 

The chart on the right plots energy generation against river flows for the Amoskeag plant. I was somewhat expecting a 1:1 linear relationship and was initially surprised to note how generation tended to start leveling off at high flowrates. However, the PSNH hydro folks pointed out that the maximum flowrate through the Amoskeag turbines is 5000 cubic feet per second (cu. ft/sec), so one would expect to see generation level off above this flowrate. Moreover, an average monthly flowrate of greater than 5000 cu. ft/sec does not necessarily mean that flow rates are higher than 5000 cu. ft/sec for 24 hours a day – there may be periods when it is substantially higher and then there are periods of lower flows.

In one of my recent posts, Down by the Water, we noted the simple mathematical relationship between energy and power:

 Energy = Power x time.

Applying this relationship to the Amoskeag operation, which has a nameplate capacity of 16 MW, and assuming 30 days per month and 24 hours per day of operation, the maximum monthly generation from the Amoskeag Dam can be calculated as

Energy = 16 MW x 30 days x 24 hr/day = 11,520 MWh

This is pretty close to the maximum monthly generation output on the chart above.

I was also surprised to note that the power generation of Garvin Falls was half that of Amoskeag although its generation capacity (12 MW) is 75% that of Amoskeag (16 MW). Calculating the total generation for both operations for 2013, I noted that Amoskeag produced 66% of its maximum electricity output (also termed its capacity factor), whereas Garvin Falls produced only 44%. It turns out that Garvin Falls is a more troublesome operation because it has a gatehouse and a narrow channel for a head race that is used to direct water into the power houses. River-borne debris, such as leaves, branches, trees, etc., build up behind the gatehouse and restrict flow to the channel, which significantly compromises the steady generation of electricity from this operation. Regular maintenance, involving the removal of debris from the screens where the water enters the power house, is required.

The Energy Information Agency, EIA, produces an average annual capacity factor for all hydro operations across the US. In 2013 it was 38.1%, which is much lower than I would have anticipated. I was expecting capacity factors for hydro operation to be of the order of 80% or so but the annual data from 2008 to 2013 shows US capacity factors ranging from 37.2% to 45.9%. The national data does indicate that the Garvin Falls and particularly the Amoskeag operation have capacity factors greater than the average US hydro operation.

There are several reasons for these lower-than-expected capacity factors for hydro operation:
  • Precipitation and river flows are variable and the maximum flow of water that the generators can handle is not always available.
  • River-borne debris and winter ice can at times significantly compromise water flows into the generating units.
  • The generating units need to be slowed or shutdown for periodic maintenance.
  • Even though hydro plants are generally the lowest cost producers of electricity when selling into the wholesale markets, they can be underbid by other generators, particularly heavily subsidized wind operations which will sometimes even pay to produce electricity. At times like these, there might not be any call for hydro power and the units are shutdown.

PSNH owns and operates several hydro operations in NH. Those listed below are owned and operated by Northeast Utilities, the parent corporation of PSNH.


Based on recent documentation submitted to the NH Public Utilities Commission, hydro operations will be responsible for about 11% of  the ~3,016,000 MWh of electricity that PSNH is planning to generate from its own facilities in 2014. These are PSNH’s lowest cost electricity generators and are thus an important asset to keep in operation and perhaps even consider expanding, even though the impacts of new or expanded hydro operations could be considerable and permitting could be extremely difficult. We have to recognize that there is a price to be paid for every energy source we use but, unlike fossil fuels where every ton of carbon dioxide we dump into the atmosphere intensifies the green-house effect, hydro plants will be still generating electricity one hundred years from now and will still not be pumping carbon dioxide into the atmosphere.

An important debate regarding these facilities is presently underway in NH (discussed in Should I Stay or Should I Go). In order to complete the electricity deregulation process in New Hampshire, it has been proposed that PSNH should be compelled to sell these hydro generating operations, along with their wood- and gas-fired operations and the large coal-burning plant on the Merrimack River in Bow. However, with electricity prices shooting up this winter and with PSNH customers, for the time being at least, somewhat shielded from these increases, this does give one pause for thought and to consider that ownership of generating operations may perhaps have some benefits. This is certainly a topic I will return to in a future post.

Until next time, remember to turn off the lights when you leave the room and, if it is raining, contemplate that the river’s gonna rise* and the hydroelectricity output will increase.

Mike Mooiman
Franklin Pierce University
mooimanm@franklinpierce.edu


(*River’s Gonna Rise – An instrumental tune by Patrick O’ Hearn, a LA bass player and electronic musician who has had a long and varied career, including stints playing bass in Frank Zappa’s band, the New Wave group, Missing Persons, as well as releasing over a dozen solo albums featuring electronic and ambient music. He is well known for his film scores and in the past few years has been playing bass in John Hiatt’s band. Here is the title track from Patrick O’ Hearn’s 1988 album River’s Gonna Rise.)

Sunday, October 5, 2014

Take Me to the River* - Hydro Power in New Hampshire – Part 2: Touring the PSNH Hydro Operations

In my last post, Down by the Water, I noted that my office looks onto the Merrimack River and the upstream Amoskeag dam and the hydroelectricity power plant that has been in operation for ninety years. In this post, I take a closer look at this power plant, which I had an opportunity to tour, as well as its sister upstream plants in Hooksett and at Garvin Falls. 

In the process of learning more about the operation of the Amoskeag Dam and the hydro plant, I was fortunate enough to be given a tour of the operations by the experienced hydro team at PSNH. The photographs below were taken during this tour. My tour of the facility was fascinating. I got a great view of the dam from the powerhouse side and was able to view the power plant from the inside.


The power plant is home to three 1920s vintage turbine and generator sets, which continue to work perfectly today and are so well designed and maintained that replacement is not warranted. As an engineer, I was very impressed to see these 90+-year old units still operating and generating electricity. The hydro industry is rather unique in the electricity generation business, in that many of the operations rely on old, well-designed equipment, which, in some cases, are 100 years old. This is a testament to past engineers who designed these units without the use of calculators, spreadsheets, or computer-aided design and drawing tools.


The Amoskeag Power Plant has a long history. The project was started by the Amoskeag Manufacturing Company, the textile manufacturing company established on the banks of the Merrimack River and which led to the founding of Manchester. The Amoskeag Mill was at one time the largest cotton textile plant in the world. At its peak, the mill was powered by thirty water turbines, twelve steam engines, and five steam turbines.  In 1918, a decision was made to completely dam the Merrimack at the Amoskeag Falls and to install a hydroelectric generating station. This was placed into operation in 1924.

During my research I was excited to uncover the photograph below from the PSNH Shoebox website, which is a collection of old PSNH-related photographs. This  shows one of the turbines being readied for installation in the Amoskeag powerhouse in the 1920s. It is still in operation today.

Photo: PSNH Shoebox

After World War I, business became difficult for the Amoskeag Manufacturing Company because the US was in recession. Furthermore, the proliferation of electrical generating operations throughout the US, and especially down south, meant that cotton did not need to be transported north to be milled and woven. High costs, aging equipment, and labor unrest eventually led to the bankruptcy of the Amoskeag Manufacturing Company and the sale of the hydro operations to PSNH in 1936.

The Amoskeag Dam spans the Merrimack River so that the river flow can be harnessed and fed through the three turbines at the Amoskeag Powerhouse (see photograph below). The average annual river flow is some 4000 cubic feet per second (cu. ft/sec) (equivalent to 1.8 million gallons per hour). At full power, the maximum combined water flow through the turbines is 5000 cu. ft/sec. This means during average river flows of 4000 cu. ft/sec, all the water, except for a 280 cu. ft/sec habitat bypass,  is directed through the turbines and there is no overflow over the top of the dam. My photographs of the water overtopping of the Amoskeag Dam were taken during the tour. Because the river flow that day was very low (~ 2000 cu. ft/sec), I was surprised to see overtopping. It turned out that the Amoskeag power house was down for maintenance because the transformers were being replaced so there was no river flow going through turbines and the full river flow, except for the bypass, was consequently all spilling over the top of the dam.

I was also fortunate to be taken down to the lower levels of the powerhouse, where I walked to the other side of the dam through a service tunnel inside the dam wall that runs along its entire length. On emerging on the other side, I got a closer look at the inflatable gate that is used to control the height of the water in the dam.


The Amoskeag dam is just one of three hydro plants operated by PSNH on a fairly short stretch of the Merrimack river, so I decided to take myself to the river* and drive upstream to visit the other two. About 7 miles above the Amoskeag dam, there is a small single turbine 1.6 MW hydro plant on the Hooksett dam;  a further 5 miles upstream is the much larger Garvin Falls Dam, which hosts four turbines in two powerhouses which have a combined capacity of 12.1 MW. The PSNH Merrimack coal-fired power plant, which uses the Merrimack River as a cooling water source, lies between these two dams. It is clear that, even today, the mighty Merrimack has an enormously important role to play in energy generation in New Hampshire. Below are some photographs from my upstream excursion.


Much of this post has been touristy in nature with descriptions of power plants, tours and lots of pictures but in the next post I will dig deeper into the technical information, such as river flows and electricity generation, associated with these hydro operations. My visits and research for these posts has given me a better understanding of the operation and importance of these hydroelectric facilities as well as a much better appreciation for the engineering design and construction skills of those old time engineers.

Until next time, remember to turn off the lights when you leave the room.

Mike Mooiman
Franklin Pierce University
mooimanm@franklinpierce.edu


(*Take Me to the River – The fabulous and heavily covered Al Green tune. The definitive cover is by the Talking Heads. Here it is from one the best concert movies ever made – “Stop Making Sense”. Turn up the volume and enjoy Take Me to River.)


Sunday, September 21, 2014

Down by the Water* - Hydro Power in New Hampshire – Part 1

My office is in Manchester, in Franklin Pierce University’s graduate school which is located in one of the renovated mill buildings located on the Merrimack River. From the conference room there is a great view of the river and the upstream Amoskeag dam. This is a 30-foot high, 710-foot long concrete dam that holds back the Merrimack River at this point so that the water can be directed through the turbines at the Amoskeag Power House located on the western bank of the Merrimack.  These turbines have a combined generating capacity of 16 MW. The photos below show my view of the dam wall and a Google Map satellite image for an overhead view. This dam was originally commissioned in 1924 to service the Manchester mills. While gazing at the river this week during a meeting, I decided it was time to turn my attention to the topic of hydro power in New Hampshire. This post is the first in a multi-part series on this topic.

Man has utilized the power of water (hydro power) for centuries. In the late 1700s and into the 1800s, advances in technology, powered by running water (and eventually by steam) is what lead to the industrial revolution. Throughout New England, textile mills were established along the main rivers, most notably the Blackstone River that runs down through Worchester, Massachusetts into Rhode Island and the Merrimack River that follows a route through New Hampshire into Massachusetts. The river flow turned water wheels and turbines which, through a system of gears, shafts, and belts, were used to drive machinery inside the mills.

In the 1880s, water-driven turbines were combined with electric generators to generate the first hydroelectricity, and in 1882 the world's first hydroelectric power plant started operation on the Fox River in Appleton, Wisconsin. From that point on, the use of hydroelectricity grew phenomenally and, in 1940, hydro generated 40% of all electricity in the US. Since then, demand for electricity has increased ten-fold, but natural gas-, coal-, and nuclear-fired operations were established to fill the need. Hydro power output grew, but its share of electricity production has dropped off to about 6 to 8% of the electricity generated in the US today.

Hydro operations range in size from the very large 6809 MW Grand Coulee Dam in Washington state, the 2515 MW of the Robert Moses Niagara Power Plant and the 2080 MW of the Hoover dam on the Colorado River to “hobby” projects less than 1 kW in capacity. (Remember there are 1000 kW in a MW.) There are about 1750 hydropower operations in the US: most of them are much smaller than in size than the very large Hoover Dam operation which we usually associate with hydropower.  In fact, most hydroelectric operations in the US are much smaller - almost 90%  are less than 30 MW in size.
Hoover Dam Hydroelectric Plan

All hydropower operations, whether private, municipal, or state-owned, are licensed by the Federal Energy Electricity Commission  (FERC) – the  federal “godfather” of the electricity business. There are 41 FERC-licensed hydro operations in NH, ranging in size from 136 MW to 58 kW.  Small projects, such as those less than 10 MW installed on an existing dam or those of less than 40 MW installed on a waterway used for another purpose (such as an irrigation canal), are exempt from FERC licensing. There are 43 such exempt facilities in NH, ranging from the 3.5 MW Gregg’s Falls operation on the Piscataquog River in Goffstown to a 5 kW operation on Marden Brook. FERC licenses often involve combinations of hydro operations run by a single operator on a stretch of water:  for example, the three PSNH operations on the Merrimack River are combined into one license. I also noted that the very large Moore and Commerford hydro plants on the Connecticut River are listed by FERC as Vermont operations. These licensing/classification artifacts can cause confusion, especially when data on generation, as provided by the Energy Information Agency (EIA) and used later in this post, is reviewed.

There are many different ways of classifying hydro operations. The first is by size. Large hydro plants in the US are generally considered to be those above 25 MW in capacity but international standards consider those above 10 MW to be large. Most of the hydro plants in New Hampshire are small operations: within this class there are subclasses which typically have the following size ranges:

·                                Mini                <1 MW
·                                Micro              <100 kW
·                                Pico                <10 kW
·                                Family             <1 kW

To give you a sense of what these capacities mean, it is important to remind ourselves of the difference between power and energy.  I discussed this topic in the I’ve Got the Power! blog a while ago. As a reminder, remember that electrical energy is the ability of an electric current to do work − such as producing motion, heat, or light. The units of electrical energy are kilowatt hours (kWh) or megawatt hours (MWh). There are 1000 kWh in one MWh. Electrical power, on the other hand, measured in kilowatts (kW) or megawatts (MW), is a capacity, i.e., the rate at which energy can be produced from a generator. Large generators, which can produce more energy per unit of time, naturally have larger capacity or power ratings.

The confusion between power and energy often stems from the similarity of the units: kilowatt hours or megawatt hours are energy units, and kilowatts or megawatts are power units. However, it is important to understand that even though the units seem similar, there is a world of difference between them. This difference stems from the simple mathematical relationship between energy and power;

Energy = Power x time.

I find it is always useful to understand these relationships from a homeowner’s point of view. Consider that an average US household uses 11,000 kWh per year of electricity (~900 kWh per month). If you had to generate that electricity yourself and you were going to do it over 24 hours a day for 365 days per year, you would need generator with a power rating of 1.3 kW.

The calculation would be done as follows:

Energy = Power x time
Power = Energy / time
Power = 11,000 kWh/(365 days x 24 hours/day) = 1.3 kW.

Of course, this calculation is based on a daily average, but our daily electricity use is actually rather “lumpy”:  there is a first peak in the morning as we turn on the lights, make coffee, heat up the house, and take hot showers, followed by a second and larger peak in the late afternoon/evening when we are making dinner, watching TV, doing the laundry, turning on the electric blanket, reading this blog, etc. If you were to actually buy a generator, you would want a unit that has a capacity of more than the average 1.3 kW so that it could handle the peaks in usage. This is why backup generators for homes often have sizes of the order of 5 kW to 15 kW. But I digress somewhat (I may come back to the topic of home generators in a future post)….

The second classification of hydro plants is by type of operation. The three main types are:

  • Reservoir or Pond-and-Release Operations: We most commonly associate these with hydropower and they involve large concrete dams holding back enormous reservoirs of water with the power plant at the base, as shown in the Hoover Dam picture above. The reservoir provides for a great deal of storage and steady power generation even during the dry season. These operations usually involve the upstream flooding of large tracts of land and significantly impact downstream water flows. The water level in the reservoir can also fluctuate greatly, depending on the incoming water flows and the discharges through the power station.
  • Run-of-River Operations: These hydroelectric plants depend on the natural drop in the river elevation. A portion of the upstream river flow is sometimes diverted through a large pipe (called a penstock) to a downstream generator plant, after which the water flow is reintroduced into the river (see the figure below). These operations often have dams at the upstream location to provide the water diversion point but their storage capacity, called pondage, is limited and, as such, these operations are more subject to the vagaries of seasonal precipitation and natural river flows. With limited storage, the reservoir level tends to remain fairly constant – excess river flow simply spills over the top of the dam. Electricity production can therefore vary substantially over time. Because these operations don’t involve large amounts of storage or flooding of large acreages of land, they tend to viewed as more environmentally friendly or “greener” than the larger reservoir operations.
  • Pumped Storage: These operations involve pumping water from a river uphill to a reservoir at a higher elevation during low electricity demand and low cost periods. When electricity demand increases and prices are high, these operations then run in reverse and the water in the reservoir is drained through a turbine back into the river, generating electricity in the process. There are a three of these operations in New England with a combined capacity of 1696 MW.


Source: IPCC

In NH, we do not have any pumped storage operations but we have reservoir and run-of-river operations.  Data from the EIA indicates that there are 92 hydro generators in NH with a combined name-plate capacity of 446 MW and a total winter capacity of 511 MW. The ten largest NH hydroelectric operations are listed below.  The Moore and Comerford dams, located on the Connecticut River which runs between New Hampshire and Vermont, are the largest hydro operations in all of New England. All operations listed are individual dams, except for the Great Lake Hydro-owned operation on the Androscoggin River in the Berlin area which is a series of different dams and 21 generating facilities. The largest PSNH-owned operation in NH (and the one that distracts me during meetings)  is the Amoskeag dam on the Merrimack River.


Source: EIA

As a wrap-up for this post, I thought a comparison with other New England states would be interesting. The table below lists total electricity production capacity (the power of the generator) and hydro capacity by state for 2012, as well as total production of electricity and hydroelectricity. The data include conventional hydro only and excludes pumped storage operations. We can see that Maine is the “hydro powerhouse” of the New England region, with the largest capacity, followed by NH. The upper New England states, New Hampshire, Vermont, and Maine  provide the bulk of the region’s hydro generation capacity.

I note with interest that, even though Maine total hydro capacity was only 17% of its total generating capacity, 26% of their electricity output for 2012 was generated from hydro. This means that their hydro plants worked very hard in 2012, which is indicated by the highest capacity factor for their combined hydro plants. (Recall from I’ve Got the Power! that capacity factor is the ratio, expressed as a percentage, of the actual electricity output from a generator over a year compared to the theoretical output if the unit operated 24 hours/day 365 days per year.) The comparative numbers for NH are quite different. In orange I have highlighted that hydro represented 10% of NH generating capacity but, in 2012, it was, surprisingly, only responsible for 7% of the NH total electricity output. The capacity factor of all NH’s hydro plants, in yellow, was therefore an extraordinary low 33%.


Source: EIA

This anomaly is quite striking and some follow-up research is warranted. It is clear that hydro power is intriguing topic and I plan to continue my explorations in future posts. Now, when I gaze out the windows at the Merrimack River and the upstream Amoskeag dam during faculty meetings, my colleagues can be assured that my distraction is not idle daydreaming; instead I will be thinking of river flows, generating plants, and capacity factors!

Until next time, remember to turn off the lights when you leave the room.

Mike Mooiman
Franklin Pierce University


(*Down by the Water – A great tune by one of my favorite indie groups, The Decemberists. These guys are great song writers and I always look forward to their new releases. Here they are from Austin City Limits – the best music show on TV. Enjoy Down by the Water.)