Today we see solar power and especially photovoltaic (PV) technology everywhere: it is powering homes and businesses, roadside warning signs, large community applications, and even larger grid-scale operations. PVs generate electricity directly from sunlight using semiconductor technology that is built into the PV panels. The ever-increasing scope of PV applications ranges from small devices that generate tiny amounts of electricity used to power calculators (outputs in the milliwatt (mW) range), to one- or two-panel systems generating 100 to 300 watts (W) to charge cell phones and provide light (often installed in developing countries), to 2 to 50 kilowatt (kW) systems that power homes and businesses, all the way to grid-scale solar farms with ratings as high as 1000 megawatts (MW). Below are photographs of some solar installations that I have recently observed.

There are two kinds of PV systems: grid-connected and off-grid systems. In grid-connected systems, the excess AC (alternating current) output of a solar operation is fed into the electrical grid to supplement the power produced by other power plants. These operations usually do not include any storage so they can only generate and supply power to the grid during daylight hours. The supply from these operations is therefore highly variable: low in the mornings and afternoons, high at midday, and cloud cover significantly reduces their output. The electrical grid needs to be managed to adjust to this variable output. Most smaller residential solar systems in the US are grid-connected, and range from large utility-scale systems to smaller home-based units in which electricity produced during the day in excess of that used by the homeowner is fed back into the grid. These systems are often bidirectional: during the day, electricity is supplied to the grid; during the night, when no solar electricity is produced, power is drawn from the main electrical grid.
The other type of solar system is not connected to the main electrical grid. These are known as off-grid systems and are typically found in off-grid homes or in remote areas far away from the grid in developing countries. These usually incorporate batteries so that any excess energy can be stored for use during evening hours. During the day, the sun generates electricity that is used to power the site, while excess electricity is stored in batteries to provide power for the evenings. Off-grid systems are sometimes combined with other means of electricity generation, such as diesel generators, that can provide backup power during cloudy conditions or when the batteries are depleted. These are referred to as hybrid systems.
Some solar systems combine grid-connected and off-grid approaches. These have battery storage, but are also connected to the grid. Such operations generate some or all of the electricity needed by the homeowner or business during the day and any excess is stored in the batteries (as opposed to sending it out to the grid); however, the grid connection is there to provide any shortfalls in power production from the solar panels or when the batteries are depleted. These systems offer the best of both worlds—they produce and use renewable energy so their electricity purchases from the grid are reduced, but the grid is there as a standby to cover any shortfalls. Solar systems utilizing the much-touted Tesla Powerwall battery systems are of this type and I anticipate that we will see many more of these systems in the future.
In the energy field, one needs to be sure to understand what is meant by the rating of a power plant, whether it be a small residential solar system or a nuclear power plant. For most power plants, say the 1244 MW Seabrook nuclear power plant in NH, the power rating refers to the output of AC electricity. In this case, it is easy to calculate how much electricity a power plant would generate over a certain time period. For example, if the Seabrook plant was running at its rated output, uninterrupted for 24 hours, the yield of electricity would be:
1244 MW x 24 hours = 29,856 MWh.
Solar system ratings are different. The PV modules produce direct current (DC) electricity and the rating of solar PV operations is given as the combined DC output capacity of the panels under the standard irradiation condition of 1000 W/m2 at 25oC – conditions known as one peak sun (see an earlier post for an explanation of irradiation and the peak sun hour concept). As I showed in my previous post, the irradiation levels are only close to one peak sun at around noontime. A solar panel will therefore only produce its rated output of DC electricity for a short period around midday; at other times, the irradiation is lower and the output is commensurately lower. But DC electricity is not particularly useful for powering our existing homes and businesses: we have to convert that DC current to AC to operate our appliances, lights, and devices. During this conversion, there are losses through the electrical system and wiring. These losses are typically of the order of 5 to 10%. There are also performance losses due to dust on panels, degradation of the panels over time, and elevated temperatures.
Intuitively, one would expect hot sunny days to be ideal for solar power generation, but an aspect of PV technology not often appreciated is that the electricity output of PV panels actually decreases as the temperature increases—by approximately 0.5%/oC. When temperatures are high, panels operating in the New England area can often reach surface temperatures of 140oF (60oC), which can cause a 10 to 12% decrease in performance. This problem is even more extreme in the sunny environments of Nevada and Arizona, where the choice of solar power may seem obvious. Furthermore, when clouds roll over the skies during the day, we can also expect a big decrease in electricity production.
Between the conversion, dust, degradation, and temperature losses, clouds, and the limited number of peak sun hours during the day, the AC output of a solar installation is, in fact, a small fraction of its DC rating. For example, the PV calculator from NREL shows that a DC-rated 1 MW solar plant in NH will produce, on average, 3.6 MWh of AC electricity per day. A 1 MW AC-rated fossil-fuel plant operating for 1 day would produce 24 MWh—almost seven times more electricity, This is an important distinction that is often forgotten. Size is important in energy production, but it is important to understand what the rated size means.
Speaking of size, the largest solar plant in NH is presently the 942 kW operation that is powering the wastewater treatment plant and other municipal buildings in Peterborough. Here are some interesting specifics about this plant:
- It cost $ 2.4 million. Half of the funds came from the Renewable Energy Fund administered by the NH Public Utilities Commission; the remainder was funded by the developer and builder of the solar array, Borrego Solar.
- The array is built on land previously covered by a holding pond at the wastewater treatment pond.
- The plant consists of 3088 Canadian Solar modules, each with a rating of 305 W.
- The project went online in November 2015.
- The benefit to Peterborough is that there was no upfront capital investment and, per the power purchase agreement, the town buys all the electricity produced by the solar array at a cost of 8c/kWh (with a 1%/year increase for next 20 years). Previously, the cost for electricity from the utility was 14c/kWh. It has been estimated that this solar installation will produce savings of $ 250,000 to $ 500,000 over the 20-year term of the agreement.
- Borrego Solar gets to sell the associated renewable energy credits and benefits from the 30% federal tax credit.
- Based on the NREL PVWatts calculator, the annual output for the Peterborough system should be 1165 MWh; however, as noted above, the output will vary from year to year depending on the irradiation conditions, temperatures, and amount of cloud cover. In 2016, the annual electricity production was 1280 MWh, which was a little better than calculated.
- The performance of the plant can be monitored online through a useful solar dashboard link.
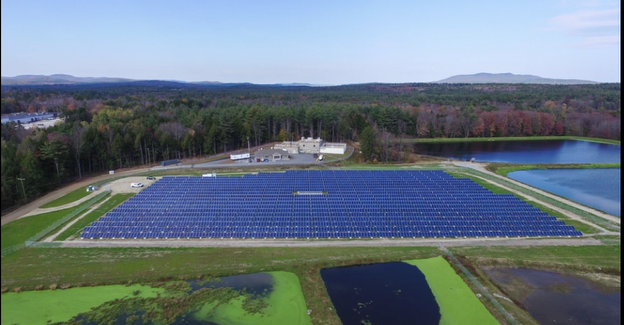
Aerial View of Peterborough Solar Plant. Source: Peterborough
The chart below shows the panel temperatures and solar radiance levels for one recent day, 7/20/17, at the Peterborough solar plant. Even though the ambient temperature only reached 90oF, the panel temperatures rose to as high as 140oF. The periodic dips in the solar power and irradiance levels are due to passing clouds.

In my next post on solar power in NH, I will look at how the state is doing with respect to solar installations. I will also highlight some recent changes that NH homeowners who are considering solar should take into account.
Until next time, remember to turn off the lights when you leave the room.
Mike Mooiman
Franklin Pierce University
mooimanm@franklinpierce.edu
No comments:
Post a Comment
Please feel free to comment but note that I have added a verification step to avoid the large amount of spam that can make its way into the comment area. An annoying but necessary step these days.