Showing posts with label electricity prices. Show all posts

Wednesday, January 25, 2017

Saving Grace* - Energy Efficiency in New Hampshire – Part 2

In my last post, I looked at the big picture of energy supply and consumption in New Hampshire, as well as some gross measures of energy efficiency (EE), viz., energy intensity and energy use per capita. The data indicated that we are making progress, but that we have a long, long way to go before we can consider ourselves energy efficient. In this post, I take a look at NH’s EE ranking and some important policy developments that will help promote EE in the state.  

The American Council on an Energy Efficient Economy (ACEEE) produces an annual scorecard that ranks the states on their EE initiatives and progress. The map below shows the state rankings in the most recent scorecard report. The ranking is done by grading each state’s utility EE programs, transportation initiatives, building energy codes, state government initiatives, and combined heat and power programs. NH’s ranking is in the midrange at # 21: we are surrounded by New England states with much better rankings, including Massachusetts, which, along with California, hold the number 1 spot.  


A closer look at the NH’s scorecard is enlightening. The figure below shows specific data regarding various scorecard components compared with those of NH’s immediate neighbors.


As you can see, NH’s scores were run-of-the-mill in the areas of utility programs, building codes, and state initiatives, and poor in transportation, appliance, and combined heat and power initiatives. The scorecard report does note that the state took a big step forward by approving new energy-savings targets for 2018 to 2020, but also remarked that NH could improve considerably in the transportation and combined heat and power sectors. Our neighbors are clearly doing more in almost all categories.

When it comes to EE, it is my view that there are three main drivers, as indicated below.


The first, and most important, are government-mandated EE programs. These include building codes, appliance efficiency standards, and fuel-economy standards for motor vehicles. These are often Federal standards, but sometimes state-specific requirements may exceed or fill in for a lack of Federal standards. Producers of the goods and services affected by such mandates are required by law to ensure that their products meet these requirements; we, as consumers, indirectly participate in EE by purchasing these goods.

The other type of EE initiatives are those in which we voluntarily participate by making non-mandated but important EE decisions; for example, the replacement of an incandescent or CFL lightbulb with a more expensive but more energy-efficient LED bulb.

The third driver for EE is energy prices. We are very basic creatures and respond to financial incentives, so if energy prices are high, be it electricity, natural gas, or gasoline, we generally take active measures to reduce our energy expenditure by driving less, buying more fuel-efficient vehicles, or putting on a sweater and turning down the thermostat. One might argue that high energy prices are just a driver of our voluntary actions; however, I see them as different because there is often an altruistic/it’s good for the planet/right-thing-to-do component to voluntary action. And if you can save boatloads of money by doing the right thing for the planet, more power to you. (Or perhaps that should be less power to you?)

For the remainder of this post, I review utility-run EE programs in NH. These are a combination of mandated and voluntary actions. The utilities are mandated to offer them, but we, as home or business owners, voluntarily participate in them, but, in doing so, we also have to open our wallets to pay for our part of these investments.

Since 2002, NH has had a formal utility-run program to promote EE investments in NH, known as the Core Energy Efficiency Program. This is a New Hampshire Public Utility Commission (NHPUC)-mandated program with required participation by the electrical and natural gas utilities. The utilities collaborate in their efforts to provide savings, information, incentives, and assistance in the implementation of EE investments to their ratepayers, which include municipalities, homeowners, and industrial and commercial operations. Information about the program is reported on the NHSaves website, which is a good place to start looking for information about energy savings and EE if you are a NH ratepayer. The program is directed at both the electrical and natural gas utilities and requires savings in both.

The NHSaves program has many features and offers a lot of services to realize energy savings. Quoting directly from the 2017 New Hampshire Statewide Energy Efficiency Plan, the elements of the program include:

  • “Working with Home Energy Raters and building contractors, to incent the construction of highly efficient homes that use 15-30 percent less energy than a standard new home. 
  •  Incentivizing insulation, air-sealing and other weatherization measures performed by qualified private contractors to reduce a homeowner’s heating fuel use by more than 15 percent on average.
  • Providing insulation, air-sealing and other weatherization measures to low-income families, saving them hundreds of dollars per year on energy costs, though a collaboration with the NH Office of Energy and Planning’s Weatherization Assistance Program and New Hampshire’s six Community Action Agencies.
  • Partnering with over 100 New Hampshire appliance retailers and suppliers across the state to help customers purchase highly efficient appliances such as refrigerators, clothes washers and room air conditioners, saving 10-20 percent of the energy they would have used if they had purchased standard efficiency models.
  •  Partnering with over 100 lighting retailers and suppliers across the state to reduce the barriers for New Hampshire customers to purchase energy efficient lighting measures that can save between $30 to $80 over the lifetime of a single product.
  • Working with qualified private contractors to help businesses and non-profits identify and install more efficient lighting, controls, motors, HVAC equipment, air compressors and industrial process equipment. 
  • Focusing on municipalities to help save energy in public buildings, reducing overall costs to taxpayers and making public spaces a model for efficiency improvements.”

To date, the goals of the NH program have been modest and the annual energy savings have been small—of the order of 0.5% of NH total energy consumption. Our neighboring states have been more aggressive in their savings; for example, in 2015, RI, MA, VT, and ME had savings of 2.91%, 3.74%, 2.01%, and 1.53% of their 2015 retail sales, respectively.

Even though NH’s annual savings have been relatively small, these small savings, year on year, have accumulated over time. It has been estimated that, since the start of the Core program, customers have saved over $1.9 billion and reduced electricity consumption by 12 billion kWh and natural gas use by 24.5 million MMBtus (million BTUs). The Core program, by most measures, has been a successful one.

These accumulated savings are great, but there is a cost for the program that NH ratepayers fund. The 2016 budget was ~$24 million for the electrical EE programs and ~$7 million for the gas programs. The electrical component has been funded by part of the Systems Benefit Charge (SBC) paid by each electrical ratepayer (in 2017, the  EE portion will be 0.198 cents/kWh of the 0..354 cents/kWh SBC charge averaged across the four utilities), money from the Regional Greenhouse Gas Initiative (RGGI) auctions that are distributed to the NE states, and from the ISO-NE capacity market. The natural gas savings program has been funded through the local distribution adjustment charge (LDAC) paid by natural gas users. Typically, the split in funding for the electrical program has been 70% from SBC funds, 19% from RGGI, 10% from the forward capacity market, and  1% from carryover and interest, whereas the natural gas savings program is funded completely from the LDAC charge.

It is important to appreciate that all ratepayers pay their share towards the program, but only those that elect to participate benefit directly and reap the big savings. To actively benefit from this program and reap the rewards requires you, as the ratepayer, to make an upfront EE investment. The amount that you have to pay depends on your utility, class of service, and particular type of EE investment. Even though there is a requirement for an upfront investment, the utility-run EE programs have been popular: there have been waiting lists and money to fund EE investments has run out before the end of each year.

Even if you don’t participate directly, you, along with other non-participating ratepayers, benefit indirectly because reduced energy consumption, regardless where it comes from, benefits us all. It improves the resiliency of our energy-delivery systems because less energy has to be sourced, it keeps our costs down because fewer power plants have to be built, our resources last longer, less pollution results, greenhouse gas emissions are reduced, local jobs are created, and, as noted in my previous post, there is a cascade of other benefits that results from EE investments.

The Core program is well run and carefully administered, and a great deal of effort is expended in evaluating its effectiveness. It is overseen by the NHPUC, but is run by the electrical and natural gas utility companies that are required to submit a joint annual plan and budget. The joint administration and shared marketing resources through the NHSaves program ensures consistency and best practice implementation across all utilities. Each utility is required to provide quarterly and annual reports and is subject to annual financial audits and independent certification of savings.   The program is a serious endeavor and is continually reviewed. THE NHPUC has over 130 reports evaluating the effectiveness of EE programs in NH and NE. I consider this to be an important and well-run, documented, audited, and verified initiative.

As part of their administration of the EE program, the utilities carefully vet the projects that are considered and each undergoes a thorough cost-effective screening. Each program is required to have a benefit-to-cost ratio above one. The costs and benefits are over the lifetime of the project (which vary depending on the nature of the project); costs include both the utility and ratepayer contributions. The specific benefit:cost goals laid out in the 2017 plan are shown in the table  below.
  
As mentioned, the utilities report annually on their EE programs, recording what was spent and what the benefits were. I have summarized some key findings from the 2015 reports in the table and bullet points below:


  • Eversource, with the largest number of customers in NH, spent the most on EE programs.
  • There are variations from utility to utility, but the end users (homeowners, commercial, industrial and municipal) are paying, on average, 45% of the costs of EE investment; the utility pays the other 55% out of their funds allocated for EE.
  • Homeowners are paying, on average, 37% of their EE investments.
  • The lifetime benefit/cost ratio is an average of 2.2, which means that, for every $ invested in EE, NH reaps over $2 in benefits in terms of energy savings.

Overall, the cost of EE investments in NH through the Core program has been estimated to be 3.7 cents/kWh. If we had spent this money on just buying more electricity, we would have paid the retail price of about 16 cents/kWh. The natural gas savings are similar: $0.336/therm for EE vs. $0.81/therm for purchase. In short, investing in EE is a bargain.

The challenge with the Core program is that, while it has been popular, funding has been limited and a lot of deserving EE projects have not yet been implemented. To support more EE savings and meet the objectives of  NH’s 10-year Energy Strategy, the NHPUC  has recently approved a new statewide utility-run EE policy, known as the Energy Efficiency Resource Standard (EERS). This program boosts the annual goals for energy efficiency and increases funding available for EE investments. It kicks in at the start of 2018 and requires utilities to increase their annual energy savings.  The EERS program was developed with significant stakeholder involvement, ranging from environmental lobbying groups, utilities, state representation, community action groups, and other energy-related non-profits. The program will be overseen by NHPUC with input from stakeholders and will be jointly administered by the utilities, as with the Core program.

The annual goals for the new EERS program, and how they compare with the recent Core program goals, are shown in the figure below.
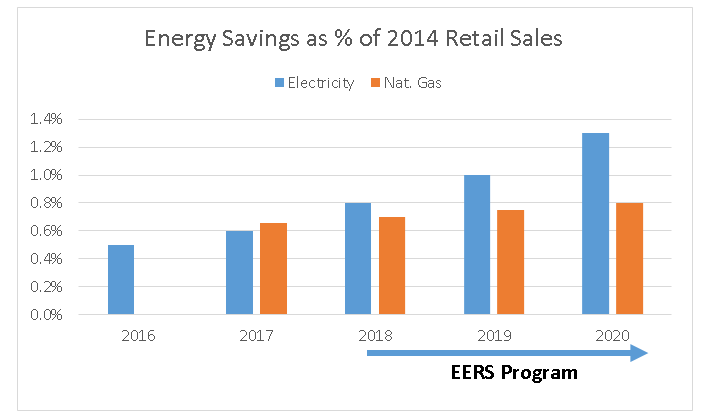
It is good to see the annual savings increase: over the next four years (2017 to 2020), there will be a cumulative savings of 3.1% of electricity and 2.25% of natural gas (compared with 2014 consumption). But, again, I need to note that, compared with our neighbors, these goals are rather humble: the average annual electrical savings increases are 2.1% for Vermont, 2.9% for Massachusetts, 2.4% for Maine, and 2.6% for Rhode Island. 

The EERS plan also has the following features:
  • Instead of the two-year planning and implementation cycles used in the Core program, the EERS program will use a three-year cycle.
  • Funding for EE investments will more than double over the next few years. In 2016, the budget for EE investments was $31 million; in 2020, it proposed to be $74 million.
  • The money for these increased EE investments will come from an increase in the SBC and LDAC components of the utility bill. The average SBC and LDAC in 2017 will be 0..354 cents/kWh and 4.95 cents/therm, increasing to 0.821 cents/kWh and 6.91 cents/therm in 2020, respectively. This will result in a $2.70 monthly increase in the electrical bill for a ratepayer using 600 kWh per month. Overall, the EERS program will contribute to a 2 to 3% increase  in NH utility bills from 2017 to 2020.
  • To compensate utilities for the lower energy sales and lost revenue associated with EE, a lost revenue adjustment mechanism (LRAM) will be implemented. This is new and is built into the SBC rate increase.
  • As with the Core program, there are built-in performance incentives to encourage utilities to make these investments. Basically, the utilities will earn a bonus for achieving above-budget energy savings.
  • The EESE Board, which is a multi-stakeholder committee that works with the NHPUC to promote energy efficiency and sustainable energy in the state, will serve as a review and advisory council.
  • Evaluation, monitoring, and verification will be carried out by independent consultants.
  • The low-income assistance portion of the program will increase from 15.5% to 17% of the total EE budget for the first three years.

There are, of course, objections to the EERS program. It will increase the bills of all ratepayers across the state, but big savings only accrue to those who participate and have the funds to foot their part of the investment. However, bear in mind that if your neighbor makes a big investment in EE and significantly reduces her monthly cost, you indirectly benefit from improved energy system resiliency, lower long-term energy costs, less pollution, etc. This is similar to the benefits that an SUV driver might derive from drivers of EE vehicles: those drivers of EE vehicles extend the lifetime of oil resources, reduce pollution, and keep oil prices down.  Ultimately, it is your choice whether to pour your dollars into your gas tank or into inefficient energy use in your home, but keep in mind that you do benefit from the EE activities of others.
  
Should you find yourself agitated by the increase in utility rates associated with the EERS program, I encourage you to take direct action that undo that increase. Go through your home and find three old style incandescent ightbulbs and change them to LED bulbs (which can be purchased for $2/bulb). The annual energy savings from these bulbs (assuming you have changed to  10W LEDs,  burning for 4 hours a day and your average electricity use per month is 600 W) will save you 2.7% of your electricity bill which more than relieves that phased SBC increase.

It must also be appreciated that EE presents a problem to regulated utility companies. They are in business to sell electricity or natural gas and thereby earn a return on their investments to pass on to their investors. (And before you get all self-righteous about money-grabbing investors, look at the companies in your retirement investments: you will mostly likely find some utility companies in your portfolio, making you one of those investors. Utility company shares have proved to be extraordinarily reliable investments with steady returns.) When utilities are obligated to make investments in EE, this reduces the amount of electricity or natural gas they sell, reduces revenue and profits, and limits opportunities to make infrastructure investments on which they can earn a return. Moreover, they have to administer these EE investments, employ staff to run these programs, and incur costs. Generally, the utilities would not be in favor of these programs so they need to be incentivized to participate. This is done by compensating them for the lost sales and costs associated with the EE program, which is built into the SBC or LDAC charges. In essence, the utilities get to sell less of their energy commodity at higher prices.

This post has covered NH’s middle-ranking EE. We are way behind our New England neighbors in EE, but the saving grace* is that that NH is in the process of transitioning from the Core to the EERS program, which is an important step forward.  Required annual energy savings will increase and EE investment budgets will more than double. This will have utility-cost implications because NH ratepayers will see a 2 to 3% increase in their utility bills over the 2017–2020 period as a result of these changes. However, these are good programs that make a difference and we all benefit and, by our implementing our own simple EE actions, like changing over to LED lightbulbs, we can cancel out the effect of the rate increase. It is a far better idea to make EE investments now that reduce our exploitation of fuel resources and reduce energy infrastructure investments. This will reduce energy cost increases in the future

However, to fully benefit from these programs requires action and investment on our part. This is something that we don’t always do—even when we know it is the right thing. I will discuss this lack of action in my next post. In the meantime, do your bit for energy efficiency and turn off the lights when you leave the room.

Mike Mooiman

Franklin Pierce University
mooimanm@franklinpierce.edu


(*Saving Grace: A fabulous tune with a great driving groove by one of my favorites: Tom Petty. From the Highway Companion album released in 2006. Enjoy Saving Grace.)

Saturday, October 1, 2016

Back Home* – Electricity Prices After the Mild Winter of 2015/2016

After a year away on my sabbatical in Botswana where I spent my time researching off-grid solar systems and learning about energy challenges in Southern Africa, I have returned home and am back to teaching and doing research at Franklin Pierce University. My time in Botswana was interesting, complicated, frustrating, and ultimately very rewarding. I had the opportunity to meet some very interesting people, I visited solar installations in some very unique and remote places, and was involved in the installation of a 20 kW photovoltaic system in a village just outside of Gaborone, the capital of the country. During my time in Botswana, I developed a far more nuanced understanding of the challenges associated with energy supply and demand in the developing world and learned to appreciate the reliable and inexpensive electricity and water supplies we have here in the US.  

Even though I plan to continue my interest in Southern African energy matters, I am now focusing again on NH energy issues. I thought it would be fitting to start where I left off a year ago and take a look at electricity prices and what the future might hold, especially after the mild weather experienced in New England last winter.

When looking at electricity prices, I always start by looking at wholesale prices. We have a very dynamic market for electricity in New England because we have a formal and well-run market organized by the independent system operator in New England, ISO-NE. (See my blog Extraordinary Machine to learn more.) We have 350 generators of electricity bidding to sell their electricity into the market. This includes nuclear power plants, coal, natural gas- and biomass-fired operations, as well as wind, solar, and hydro. This all makes for an interesting and dynamic market.

The figure below shows historical wholesale prices for electricity going back to 2010. It is interesting to note that, after three winters of spiking electricity prices, prices were very calm this past winter. This resulted from several factors.

Source: EIA

 First and most important, it was a mild winter – some have called it the winter that wasn’t (while I was away in Africa, my snow blower only received one workout). A good indication of how mild the winter was comes from examining the heating degree days (HDDs) (see A Hundred and Ten in the Shade for an explanation of heating degree days). The chart below shows HDDs for the past 12 years. We normally experience about 7000 HDD over a year (July to June) in NH and 6000 for the whole of NE; this past year, the values were ~15% lower, with values of 6000 and 5300, respectively. That was indeed a whole lot warmer, but I was taken by surprise that the HDD values for 2012/13 indicated an even warmer winter that year. Like many other folks, I tend have a short memory about past winters, except when they are extreme, but the data show that the winter of 2012/13 was the warmest in the past 12 years – at least as measured by HDDs values. An examination of the wholesale prices for that winter in the figure above shows some daily prices spikes, but nothing to the degree we experienced in the following three winters.
Source: ISO-NE

The other key driver for low electricity prices is low natural gas prices. Over the past winter, ~55% of the electricity produced in New England was from natural gas: as a result, natural gas prices had a big impact on what we paid for electricity. The two big uses of natural gas in NE are for home heating and electricity production. With the mild winter, there was enough natural gas to go around for both heating and generation. Daily prices did not spike, which was quite different from previous years. The figure below shows the extraordinarily tight correlation between natural gas prices and electricity prices in NE – when natural gas prices spike so do electricity prices.

Source: ISO-NE

Wholesale prices for electricity are presently of the order of 2 c/kWh. This is great, but what are the implications for us as retail electricity customers? Well, less positive than we would like. In NH this past winter, retail electricity prices were in the region of 18c/kWh, almost 9 times the wholesale rate, as shown in the figure below.

Source: EIA

It is important to appreciate that wholesale electricity prices are a small component of what we, as rate payers, shell out for electricity. Baked into the retail rates are a host of charges: there are charges to pay for the transmission and distribution networks; there are long-term contracts that the utilities have entered to purchase electricity (most likely at higher than 2 c/kWh); there are overheads, salaries for the utility company employees, etc.; and, in the case of Eversource, there is the cost of operating their generating facilities – which produce electricity for a whole lot more than 2 c/kWh. On top of this is the profit that the regulated utilities are allowed to earn on their investment in infrastructure. It is a long list of costs and additional charges that gets us all the way from 2 to 18 c/kWh and well worth a closer look in a future blog. It turns out that the utilities from which we buy our electricity end up buying a relatively small portion of their electricity from the wholesale market – a lot of their supply is from long-term contracts that they signed up for years ago. Of course, when wholesale prices are low we don’t like this but, when prices spike up to 45 c/kWh, as they did in the winter of 2013/14, we are quite grateful that our electricity suppliers have locked into lower cost long-term contracts.

Despite last year’s mild winter weather, if this upcoming winter were to be a very cold one, we should expect to see spikes in both natural gas prices and wholesale electricity rates that will impact what we pay for electricity. ISO-NE has taken some important steps in New England to mitigate these spikes through their winter reliability program and by increasing storage of liquefied natural gas, but we have not taken any steps to significantly increase natural gas supply. If we have a very cold winter again, we will see price spikes and then we will go through another round of handwringing and planning for increasing natural gas supply. The truth of the matter is that we do not have a long-term view about our energy supply here in New England. Plans to increase natural gas supply have been scuttled due to opposition or our desire to have the pipeline companies take all the risk. These are both good reasons for not increasing supply, but we must bear in mind that most existing energy infrastructure in the US has been built with some government intervention via regulated monopolies. Ultimately, every one of those infrastructure investments impacted somebody somewhere. If we do not want to invest in energy efficiency, we as energy consumers will end up paying in one of two ways: we will pay for infrastructure investments through costs and direct impacts on our property, our environment, and way of life, or we will suffer the consequences of not investing in infrastructure and creating unreliable supply conditions. Ultimately, it is our choice.

I like to take a look at what the futures markets are predicting for NE electricity prices and, even though futures markets are about looking forward, I also like to look back at their prices from the previous year and see how things have changed, especially with the warm winter we had. The figure below is a comparison of the future prices from last year with those at present. It is clear that there has been some change in the market’s view of upcoming electricity prices. As usual, we are seeing a market forecast of winter price spikes, but, compared with last year, the spikes are smaller and the base-line prices are also lower. This chart also gives one a sense of the challenges the utility companies face as they look to lock in sufficient electricity to supply us over the coming years. Do they secure long-term higher-priced electricity contracts, do they subject us to the whims of the short-term markets and maybe prices won’t spike again like last winter, or do they mitigate potential price spikes by buying insurance through futures contracts. These are important and challenging decisions that the utilities make under regulatory supervision because ultimately it is NH ratepayers that end up paying for whatever choice they make. What would you do?

Source: CME

As we consider the consequences of choices, I am going to wrap up this data-heavy post with an updated chart for default electricity rates for the four NH regulated electricity utilities. (Remember that default rates only reflect the retail costs of electricity and do not include the distribution costs.) These rates, shown below, are a direct reflection of the choices the utilities have made, under regulatory mandates, regarding the sourcing of electricity. Presently, PSNH default rates are substantially higher than those of Liberty, Unitil, and the NH Electric Cooperative. The rates for PSNH presently reflect the high costs associated with operating their own generation facilities, including the coal-fired Merrimack power plant. Even though there have been times that the rates for the other utilities have been higher than those for PSNH (due to wholesale market price spikes), their default rates have generally been lower. Now that the divestiture of the PSNH generating assets has finally started, it will be interesting to follow how PSNH’s rates in the future will compare with those of the other NH utilities.

Source: NH PUC

That wraps it up for this post. It is good to be back teaching in NH and learning about statewide energy matters. Feel free to email me to suggest topics for future blogs and, in the meantime, remember to turn off the lights when you leave the room.

Mike Mooiman
Franklin Pierce University
mooimanm@franklinpierce.edu


*Back Home A great upbeat singalong tune by Andy Grammar

Tuesday, August 4, 2015

Next Year* - New Hampshire Electricity Price Update

While we are all enjoying the fine summer weather, I thought it would be useful to take a look back at electricity rates for this past winter and to think about what the coming winter might hold for us. Before we get into this topic, however, I need to note that this will be my last blog on New Hampshire energy issues for the next year. I am heading off to Botswana, Southern Africa, as a Fulbright scholar, where I will be studying energy matters in Botswana, with a particular focus on the solar energy field and storage technologies. As you can imagine, the energy issues in a developing country are quite different. Here in NH, we are all used to reliable, inexpensive electricity whereas, in Africa, two-thirds of the population do not even have access to electricity, it can be very expensive, and, when available, it is often not reliable. In NH, we sometimes seem intent on blocking the development of any energy projects, whereas in Africa energy infrastructure development is welcomed, encouraged, and supported. The energy field and the associated issues will be quite different and I am looking forward to learning more. While down in Southern Africa, I will be firing up a new blog, titled Energy in Botswana, so if you are interested in following my energy explorations in this part of the world, drop me an email and I will put you on a notification list. But back to NH energy matters…

In my last blog on electricity rates in NH, Gonna Take You Higher, I noted the following:
  • Wholesale prices (and thus retail prices) for electricity during the 2013/2014 winter increased due to natural gas pipeline constraints.
  • The three deregulated utilities—NH Electric Co-op, Unitil, and Liberty Utilities— substantially increased in their winter default service rates, with price increases ranging from 60 to 75%.
  • PSNH rates only increased by 4% and they ended up with the lowest rates in the state.
  • The increases were due to the fact that Unitil and Liberty Utilities were compelled to lock in electricity prices from the short-term 2014/2015 futures market for electricity where prices had skyrocketed due to the high prices of the 2013/2014 wholesale market.
  • I made the recommendation that the utilities should not be restricted to purchasing their future electricity supply to just six months out and that they be allowed to adopt a portfolio approach of both long- and short-term electricity supply agreements to mitigate the effects of short-term price spikes.

I thought it would be interesting to take a look at what actually happened over the winter and what has happened since then.

As shown in the figure below, wholesale electricity prices did spike over the winter but nowhere near the frequency, duration, or magnitude of the previous winter. Peak prices were even lower than those of the 2012/2013 winter.
Data Source: EIA

Compared with the previous two winters, prices increases this year were moderate and actual wholesale rates were lower than the futures prices at the start of the season. In October 2014, futures prices for the winter peak in January and February were ~18 c/kWh (see Gonna Take You Higher).  In January and February 2015, although the wholesale market prices peaked at ~12 c/kWh for January and 20 c/kWh for February, the daily averages for those months were a lot lower—at 8.7 and 13.7 c/kWh, respectively.

This means that when  the electrical utilities bought electricity on the futures market, it is likely they overpaid relative to actual day-ahead wholesale prices. However, this the essence of hedging (or locking in) the price of a commodity ahead of the time you actually need it:  if actual prices turn out to be lower, you end up overpaying, but, if prices end up higher, you are very pleased. Hedging is just like paying for insurance – you pay a premium to protect yourself: it is not about getting the lowest possible price; rather, it is about reducing risk and avoiding exposure to excessive price increases.

After those very large winter increases, the summer default rates plummeted and the three deregulated utilities ended up with rates lower than that of PSNH, which again had the highest rates in the state. The figure below gives an historical record of the default rates for the four NH electrical utilities.

Data Source: Courtesy of NH PUC

Futures prices for electricity for the upcoming winter are currently pretty low compared with those of years past (see the figure below).  The futures markets indicate prices of the order of 12 c/kWh for the Jan/Feb 2016 winter peak, with further decreases expected in the following winters. These lower futures prices are most likely a reflection of the changes that we are seeing in the New England electricity market. The local electricity supply coordinator, ISO-NE, has worked hard to mitigate the extent and duration of the winter spikes by implementing a winter reliability program in which owners of oil-based generating facilities and liquefied natural gas storage operations are paid to store fuel. This ensures a reliable and predicable backup supply of alternative fuels to generate electricity should there be bottlenecks in the natural gas supply from pipelines. 

Data Source: CME
My predictions for electricity rates for the next few years are that we will continue to see short-term winter spikes due to natural gas pipeline congestion during high demand periods but that these spikes will moderate over time as ISO-NE expands and improves its winter reliability program, as some the natural gas pipeline projects get implemented, and as more Canadian hydro power makes its way down to New England.

Since the deregulation of electricity supply in NH, customers are no longer compelled to purchase their electricity from their default provider. Given the big fluctuations in default energy rates and the availability of competitive suppliers, I thought it would be interesting to look at how customers have responded – are they flocking to competitive suppliers or are they staying with their default utility? I took a look at the customer migration numbers for PSNH – the largest NH utility. The chart below shows data for the past three years. The data in orange show that, from about July 2012, the number of residential customers purchasing their electricity from competitive suppliers started to accelerate, and this trend really kicked in in the first quarter of 2013 when there was big movement of customers to competitive suppliers. The numbers reached a peak at the end of 2013, when approximately 28% of PSNH residential electricity customers were supplied by other companies. Since then, there has been a slow decrease and, presently, some 20% of the electricity supply to residences comes from competitive suppliers. The data in blue, which is for all PSNH customers (including small and large commercial and industrial enterprises), show that, in October 2013, almost 60% of all electricity distributed by PSNH came from competitive supplies. The numbers have fluctuated since then but, this past winter, this number fell below 40%, corresponding to a big migration back to PSNH due to their lower default rates. There is now a slow movement away from PSNH again, as lower summer rates begin to appear attractive to the commercial and industrial enterprises. 

Data Source: NH PUC

Some months ago I wrote about a website called shopenergyplans.com, which allows you to compare electricity costs from competitive suppliers in your service area. At that time, shopenergyplan.com was only presenting information for suppliers who agreed to have their rates posted. Shopenergyplans.com has advanced since then and now provides details for a larger number of competitive suppliers. In my last blog on this topic, I noted that rates for only three competitive suppliers were listed for the Manchester service area. Yesterday, I noted that are now seven different suppliers listed, with 40 different plans, ranging from 1 to 36 months, and including various renewable energy sources. A few weeks ago, shopenergyplans.com notified me of two electricity supply plans from competitive suppliers offering lower rates in the PSNH service area. This website is a good place to start if you are considering looking for a competitive supplier but I caution you to do your research and make sure that you understand the contract terms – remember that there can be costs for switching and the competitive suppliers can shunt you back to the service utility in your area at their discretion.

As I noted at the start, this will be my last blog until I return next year.* If you are interested in following my energy adventures down in Botswana, please drop me a note at my email address below. In the meantime, thank you for your interest in my work. Keep in touch, let me know what is happening in NH while I am away, and remember to turn off the lights when you leave the room.

Mike Mooiman
Franklin Pierce University
mooimanm@franklinpierce.edu


(*Next Year - A very appropriate song by the Foo Fighters featuring the ubiquitous Dave Grohl. Great video too. Enjoy Next Year.

Friday, January 2, 2015

It’s Time to Move On* - Competitive Electricity Supply in New Hampshire

In my last few posts, I have been writing about the electrical utilities and their winter rates. In this post, I take a look at the competitive energy suppliers in New Hampshire.

Electricity consumers in NH have a choice. They can go out and pick their electricity supplier or they can simply leave it to their utility to source and supply their electricity under the so-called default electrical service rate (see Gonna Take You Higher post).The move to competitive electricity supply has gone through two waves. In 2006, five years after the onset of electricity deregulation in NH, there was a massive migration of commercial and industrial customers to competitive suppliers. In 2011, there was a second wave of migration, this time by retail customers. Right now, about 50% of the electricity supply in NH is from competitive suppliers. The table below shows data for overall competitive supply for the NH electrical utilities and some information for large commercial and residential customers. It is clear that competitive suppliers provide most of the electricity for large commercial customers. In the case of PSNH, this is a stunning 96%, which, as I have noted before, leaves the residential customers responsible for picking up most of the costs for PSNH’s generating assets.
There are three types of electricity providers in NH. There is the utility itself which the default supplier, and then there are competitive suppliers and aggregators. At last count, there were 25 competitive suppliers and 90(!) aggregators.

The competitive suppliers approved to offer electricity supply are listed on the NH Public Utilities Commission (PUC) website. Not all of these companies supply to residential customers: some specialize just in the larger commercial and industrial  customers. Of the 25 competitive suppliers, 16 supply to the residential market but not all suppliers are active in all utility service areas.

Suppliers actually have to source the electricity and work with the utility to get it delivered to your home. Aggregators adopt a different approach. They will do the shopping for you and will go out to competitive suppliers and find a good rate for you. Once they do this, and you agree to the terms, they will then switch you to the competitive supplier. Aggregators tend to specialize in specific markets, e.g. small commercial customers or geographic areas. 

The table below shows which suppliers are active in which electrical utility service areas.

Some of you may recall the drama caused last year by one of the competitive suppliers, Power New England (PNE) and its aggregator, Resident Power, when PNE was suspended by ISO-NE for cash-flow problems created by high electricity rates in the winter of 2013. With the suspension of PNE, about 7000 customers had to be transferred back to the default service of PSNH over a weekend.

There are some key points that everyone should know about competitive suppliers:

  • Competitive suppliers are not regulated. Their prices and terms are not subjected to the same scrutiny as those provided by the utilities through their default service rates.
  • Do your homework. Look at the rates and request the terms and conditions.
  • Competitive suppliers offer fixed and variable prices.
  • There can be costs for switching.
  • Competitive suppliers can shunt you back to the service utility at their discretion.
  • The utility is always there as a backstop, in case your competitive supplier cannot supply electricity or goes under.

The NH PUC provides helpful information on competitive suppliers, including a useful list of FAQs and, particularly, a valuable list of questions to ask suppliers.

One of the challenges we face as consumers is that sometimes there is simply too much choice. It is well known that, in the face of too much choice, we often pick the easiest option – which is usually the default option. How many of us really have the time to call those 16 competitive suppliers and the compare their rates and terms?

This is where information-aggregation tools, such as Kayak for airline prices, are so useful. In one simple search, you can look at most airline rates on one page. One would hope that a similar tool would be available for competitive electrical supply, but, unfortunately, similar tools for NH electricity shoppers are not as helpful.

ShopEnergyPlans.com is one such site, but only a limited number of suppliers post their rates on the website. Recent examination of the website showed only three vendors in the PSNH service area. I chatted to Andre Ramirez, one of the co-founders of ShopEnergyPlans.com, about this. Although he has contacted most of the NH suppliers, there is a reluctance for many suppliers to openly exhibit their rates on an aggregator website. On reflection, I think this is understandable, particularly for a price-sensitive commodity, such as electricity, where customer loyalty is very price-dependent. It is the lowest price that will command the most interest, so many vendors choose not to post when their prices are higher.

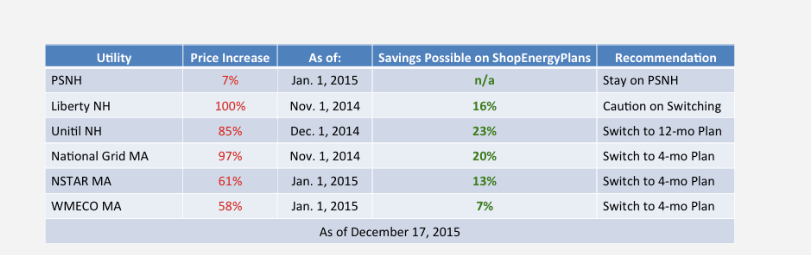
In my chat with Andre, I did learn of a new feature offered by ShopEnergyPlans called PlanTracker. This is a notification tool that sends out emails with recommendations for actions to take regarding your electricity supplier. Having entered Manchester as the zip code for my energy service provider, this morning I received an email recommending that I stay with PSNH for the time being. A list of their recent recommendations for New Hampshire and Massachusetts are tabulated below. I think PlanTracker is a useful service and is a great way to keep on top of changes.


Although I understand why vendors may not want to post their information on an information aggregation website, such as ShopEnergyPlans, I still wanted to know what rates these other vendors were offering, so I spent a morning visiting the websites of all competitive suppliers for residential electricity in the NH service areas and collected the information in the rather large table below. In the process, I was subjected to an overdose of photographs of outrageously illuminated homes or of happy families in warm (and uncluttered) homes, playing on the carpets or looking at their laptops or smart phones, as well as more short videos featuring cute cartoon characters than one person should watch.


The table shows all competitive suppliers servicing the four NH utilities. Orange indicates that the supplier has not registered to supply electricity in that particular service area. Yellow highlights indicate areas where the supplier has registered but is not yet offering service (as indicated by their websites).  The non-highlighted areas, of course, indicate that rates were available on the various websites and I present the lowest rates for particular services. Many of these vendors offer “green,” or renewable energy, options or a blend of renewable and fossil fuel options. I did not consider these, but simply looked for the lowest rates. Here is what I learned from this exercise of cutting through the overgrowth of website based electricity supply marketing in NH.
  • Many vendors offer fixed-period and variable options – variable electricity prices are not posted. It is probably a challenge to keep variable rates updated regularly and this is perhaps not a popular option.
  • For the smaller utilities (NHEC, Liberty, and Unitil), competitive vendors do not seem to have made headway in their service areas and limited choices are available.
  • PSNH has the most competitive suppliers offering prices.
  • There can be a wide range of prices offered by competitors in a service area.
  • Many of the competitive suppliers have cancellation fees associated with their fixed-term contracts, so if you want to jump early, you will end up with some additional costs.
  • Not all suppliers offer contracts across all service periods. Some just offer a vanilla option of a single rate for 12 months.
I am sure I may have been able to gather price information for the vendors with unlisted prices if I called each utility, but that would have taken up even more time. It also serves to make the point that, even though NH has competitive electricity supply, finding and comparing rates is a time-consuming task.  My overall assessment of competitive electricity supply in NH is that we still have a long way to go. I would have thought that competitive suppliers would be falling over themselves in the NH market, that more choices would have been available for residents, and that price information would be more accessible.  

In the deregulation process to date, the companies that have done well are the large competitive suppliers, such as Constellation and TransCanada, that have focused on the large industrial and commercial customers and have won a great deal of this business. The table below, based on Energy Information Agency 2012 data, show that these competitive suppliers are now the second- and fourth-largest electricity suppliers in NH.

These competitors have been very successful at drawing large users of electricity away from the utilities and there is now a slower picking away at residential customers by smaller competitors focused on this market. It always astounds me that more than 50% of PSNH electricity sales are going to competitive suppliers (see the first table in this post), leaving a smaller and smaller base of residential customers picking up the tab for those PSNH plants. Rough calculations show that, if the costs in PSNH’s recent filing are accurate and we assume that 60% of their costs are fixed, and if PSNH supplied electricity to all their customers, then their costs per kWh of electricity could be as much as 30% lower than their present default rate.  

What do we take from this?  This half-hearted and incomplete process of electricity deregulation in NH has hurt PSNH residential rate payers. We understand that it is complicated but the process needs to be completed. It is time to move forward and get the job done. Either pull the plug on deregulation or get it done.

In the words of that great rock and roll sage, Tom Petty*

It’s time to move on, it’s time to get going.
And what lies ahead I have no way of knowing
but under my feet, the grass is growing.
It’s time to move on, it’s time to get going.

Until next time, remember to turn off the lights when you leave the room.
Mike Mooiman
Franklin Pierce University
mooimanm@franklinpierce.edu


(*It’s Time to Move On – A tune from one of my favorite Tom Petty’s albums, Wildflowers. Here is Petty performing the tune live in 1994. It’s Time To Move On)