I have done an interesting analysis of statewide energy flows in New Hampshire based on 2010 data that is available from the Energy Information Agency. In this analysis I have looked at energy supply, utilization and final usage, and it makes for a useful overview of what happens to energy in the State. The analysis is shown in Figure 1 and there are three key columns in this diagram as well as a whole lot of arrows radiating out from one column to the next. At first glance the amount of information presented in this graphic is somewhat overwhelming due to the spider web of arrows and allocation percentages so it takes a lot of work to understand all aspects of this picture. To counter this information overload I will, in the next few blog posts, pull this figure apart, column by column, to build up a picture of energy supply and use in the State.

For the moment, let's focus on the columns. The left column shows energy supply to NH, the center column shows how the energy is directly used and the column on the right shows the final disposition of energy once part of the energy supply has been converted to electricity and distributed to the various users. It is important to remember that electricity is not actually an energy source; instead it is an energy transfer medium - it is the way we get stored energy out of coal or natural gas into a usable form that can power the electrical appliances in our homes and businesses. This is why we need this three column picture – the first two columns show how the supply is converted into direct use in transportation, heating our homes and businesses as well as the portion that goes into the generation of electricity. The right hand column shows how all this energy is finally utilized.
In this post I am going to be taking a close look at the first column which shows the energy supply to New Hampshire. This will be followed by a post about the middle column which will describe what we do with all the energy supplied to the State and then in a third post I will take a look at the column to the right which presents the final usage of energy in New Hampshire after it has been converted to electricity and distributed to the different users.

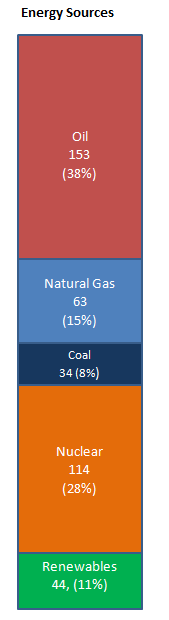
In 2010 the total supply of energy to New Hampshire was 409 trillion BTUs. Working from the top and starting with the fossil fuels, it can seen that the biggest slice of the energy supply, 38%, comes from crude oil based fuels. The other two fossil fuels, natural gas and coal, furnish 15% and 8% of the state's needs, respectively. Overall fossil fuels provided 60% of the State's energy sources. Nuclear energy is an important component of NH's overall energy supply and represents about 28% of the overall amount. Renewables, which include hydroelectric, wood, waste and ethanol in gasoline, are an important 11% of NH's energy input. A small amount of electricity was purchased from out of state in 2010, but the amount is so small, less than 0.5% of the total energy supply, that it was not included in these figures.
The following figure shows how New Hampshire's energy supply has changed over the past 50 years.
The following figure shows how New Hampshire's energy supply has changed over the past 50 years.

Some interesting points arise from this historical chart.
- There has been impressive growth in the energy supply to the State. Energy supply as increased almost four fold - we have gone from 117 trillion BTUs in 1960 to 409 trillion in 2010. This is an annual growth rate of 2.5% per year compounded over 50 years which is very much lower than the equivalent 7.5% growth rate of the NH Gross State Product over the same period.
- Since 1970 there has been relatively little change in the amount of oil based products supplied to the state. We will look at the reasons behind this in a future post.
- Natural gas use has grown substantially over the past 20 years and its use has almost doubled over the past 10 years.
- Except for some increases in the 1990s, coal use in the state has been fairly steady. However with large amounts of cheap natural gas available, I am anticipating decreases in NH's coal usage.
- Since the commissioning of the Seabrook Nuclear plant in 1990 increasing amounts of nuclear energy have been added to the State's energy supply.
- The renewable component of energy supply to the State, which largely comes from hydroelectricity and biomass, has not changed much since 1990.
So what are our main takeaways from all this information? Clearly there have been tremendous increases in the supply of energy to the state and, except for substantial increases in energy supplied by nuclear and natural gas, there has been relatively little change in the other components of the energy supply equation. We are still dependent on fossil fuels for 60% of our energy needs so, in some respects, the minor changes in the amount of energy from renewable resources could be viewed as disappointing.
What do these facts tell us about the future? Well it looks like nuclear is here to stay and, as long as natural gas remains cheap, the amount of coal burnt in NH should decrease, but we should not expect large amounts of renewable energy to come in and create a wholesale displacement of fossil fuels or nuclear. At this time, the economics and technology do not work. This is our state as well as our national energy reality.
Until next time, remember to turn off those lights when you leave the room.
Until next time, remember to turn off those lights when you leave the room.
Mike Mooiman
Franklin Pierce University
Franklin Pierce University
No comments:
Post a Comment
Please feel free to comment but note that I have added a verification step to avoid the large amount of spam that can make its way into the comment area. An annoying but necessary step these days.