Wednesday, January 22, 2020

Residential Electricity Prices in New Hampshire – Has Deregulation Delivered?

One of the first bits of energy news I looked at in the New Year was the updated information from the Energy Information Agency (EIA) on annual electricity prices across the US. This information takes a long time to collect and prepare, so it is only current to the end of 2018. Below, I have plotted the historical residential electricity prices for the US and New Hampshire.


There are a few important points to take from this chart.
  • There was a run up in NH electricity prices in the early 1990s followed by a fall off around the start of the millennium, and since 2003 we have seen an almost consistent price increase year after year. Since 1990, retail prices for electricity in the US have increased by 60%, whereas those in NH have increased by 87%.
  • In 2018, electricity prices in NH were 62% higher than the national average. This is the largest difference since the mid-1990s.
In NH, we (and I include myself) spend a lot of time wringing our hands and bemoaning our excessive electrical rates, which are the  6th highest in the US: these grumbles are certainly supported by the data in the chart above.

As high as our electrical charges are, we need to appreciate that electrical rates are only one component of our electrical bills. The other important piece is how much electricity we use. I used the same data source and calculated the average monthly electricity consumption for each household in NH and the US for the same time period. The data are plotted below. I was impressed to note that the average NH electrical consumption has hovered around 600 kWh/month for the last 28 years, whereas the average consumption for the US has increased from 800 to 900 kWh/month.


Combining average monthly consumption and the retail electricity rates (via multiplication) yields the result that in 2018 the average NH electrical bill was $122/month vs. $118 for the US. That is a substantially smaller difference than I expected and has made me a little less fretful about electricity prices in NH. Yes, they are among the highest in the US, but our Yankee frugality combined with our lower dependence on electrical heating and air conditioning, as well as investments in energy efficiency, have led us to electrical bills that are very much on a par with the average for the US.

There is another way to analyze these numbers. I took the monthly bills, annualized them, and calculated them as a percent of the average annual household income, which I assembled from US Census data. For NH, the number in 2018 is 1.7%, which is down from 2.3% in 1990. The equivalent average numbers for the US have risen from 1.6% to 2.2% over the 1990–2018 time period. This indicates that, as a percent of household income, electrical bills in NH are lower than the US average.

All things considered, I think paying 1.7% of our income for reliable electricity supply that is there at a click of a switch is a small price to pay. However, this does not mean that we should not be concerned about electricity costs in NH. We should. My calculations use an average household income of $81,000 for NH. If you are earning substantially less than that amount, your costs for electricity can very quickly balloon to over 5% of your income and, if you are watching your pennies, every rate increase has a significant impact.

Whenever I look at historical electrical rates, I think about the impact of deregulation, which started in 1997 in NH and was only recently completed with the final sale of Eversource’s generating assets in 2018. As I have written in previous blog posts, deregulation required that electrical utilities get out of the electricity-generating business, but left them with the transmission and distribution monopolies in their service area. As a result, NH ratepayers now have the opportunity to purchase power from competitive suppliers or from their utilities who have to go into the open market to procure that electricity from independent generators.

The whole point of deregulation was to remove the monopoly of the utility and to bring competition into the electricity supply business and that prices would fall as a result. After 20+ years of deregulation, the results for NH have been a bit of a mixed bag. Yes, the large industrial and commercial enterprises in the state have benefited and, as individual rate payers, we now can choose who we buy electricity from, but, as the previous chart showed, it has certainly not brought down residential electricity prices.

In the Energy and Sustainability courses I teach at Franklin Pierce University, my students and I spend a fair amount of time debating the success of deregulation efforts in the US. There are now 17 states that have some form of electricity deregulation and it is hard to point at any fabulous success stories, whereas some stunning disasters, such as California’s attempts at deregulation and the subsequent bankruptcy of some of its largest utilities, have ensued.

I am always interested in good ideas and novel experiments: my view of deregulation is that it has been both of these. However, what is more important is looking back and understanding if these experiments and ideas have worked and, if they haven’t, perhaps we should consider trying something else.

With that said, I followed the approach of the folks from the American Public Power Association, who took a look at residential electrical rates from 1997, which is considered the first official year of electricity deregulation in the US . I looked at data for NH, and the US (this includes data from the chart above) as well as for the deregulated states (which include NH, MA, ME,  RI, CT, NY, NJ, DE, IL,CA, MI, OH, TX, DC, MT, MD). This is presented in the chart below, along with some data in the accompanying table.

We can observe that, in all cases, there have been overall price escalations, but for NH and the other deregulated states, the increases started from a higher base. The challenge with this data is how do we compare the relative increases – do we do this on the basis of the overall increase, the average annual increase, or the compounded annual growth rate, and, most importantly, what do we use as our time frame and starting date? In the table, I present data for the overall nominal and percent increases from a starting point to 2018. I chose three start dates for the comparisons: the first was 1997 – the date when deregulation became law in NH; the second was 2002, the year of the lowest NH electricity prices since deregulation; and 2012, which is when, based on the data, residential customer choice really kicked in at Eversource, the largest utility in NH.

In the first case, the data show that overall percent increases for electricity in NH and the deregulated states from 1997 were lower than those for the regulated states and the US overall because they started from a higher base. However if we use 2002 or 2012 as the base year, the increases for NH are substantially greater than for the US, the deregulated states, and the regulated states.

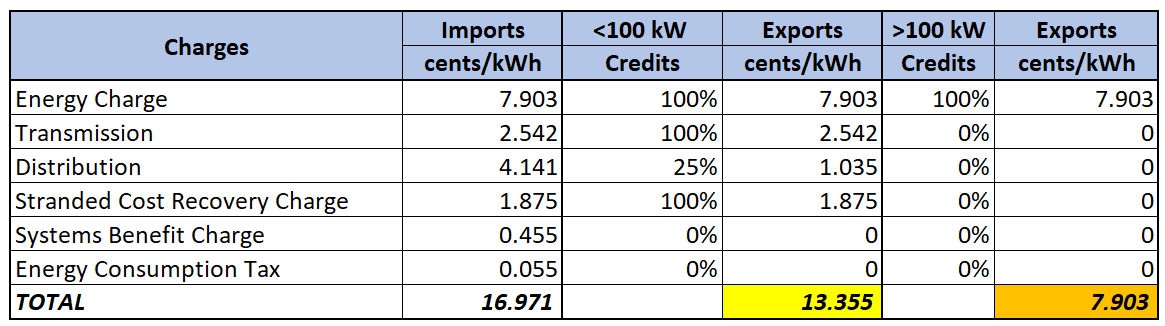
These analyses and comparisons are further complicated because deregulation only deals with the electricity-supply portion of the overall electricity price, which is about 60% of our overall electrical rates. There are a lot of factors baked into our electricity prices. There is the cost of electricity, which includes wholesale costs, long-term supply contracts, as well as the necessity to source renewable energy required by the renewable portfolio standard. And then there are transmission, distribution costs, systems benefit charges, service fees, and penalties for past mistakes and regulatory changes (in the form of stranded costs) and well as built-in profits for the utilities.

At this time, there is little evidence that residential rate payers in NH have benefited from deregulation. Although the large industrial and commercial users in the state have profited from the changes, I am hard pressed to make the case that deregulation has been good for residential rate payers. Yes, we can now choose to buy electricity from suppliers that source from renewable power generators (at a higher cost) and some might propose that deregulation had an impact by inhibiting larger prices increases. This is a weak argument to make because lower wholesale prices, driven by lower natural gas prices, have had a larger mitigating effect on price increases than deregulation.

Further evidence of the small impact that deregulation has had on residential rate payers in NH is the observation that only ~20% of NH residences have elected to go with a competitive provider. Moreover my recent review of electricity offerings from competitive suppliers shows that, in most cases, the default rates offered by the local utilities rates are, at this time, mostly lower than the competitive suppliers operating in the state. There are exceptions, but the differences are generally small and generally do not last over time. Not only are there concerns that deregulation has not benefited rate payers, but recent studies from other states have shown that residential rate payers have been penalized for participating in the competitive electricity supply market and that low-income customers suffer the bulk of the harm.

Deregulation seemed like a good idea at the time: we have tried it out but it has not worked out the way we thought it would. There have been benefits, but, in this case, competition and the “invisible hand” of the market have not led to lower residential rates. I think it is now time for us to take a long hard look at this experiment and to figure out if there is a better way. NH was the first state to the deregulation party and we should be the first to take a deep data-driven look at alternatives. I will be taking a closer look at this issue in future blogs. In the meantime, do your bit and turn off the lights when you leave the room.

Mike Mooiman
Franklin Pierce University
mooimanm@franklinpierce.edu
Click on this link to receive email notifications for Energy in New Hampshire updates

PS: For those of you interested in looking at competitive electricity rates, the NH Public Utilities Commission now publishes information about the competitive suppliers and their rates on the PUC website at the following link. https://www.puc.nh.gov/ceps/shop.aspx

Sunday, April 22, 2018

Tolemac Solar – A New Hampshire Community Solar Project

Several of my recent posts have been concerned with solar power in New Hampshire. This topic continues to intrigue me, so I am continuing my explorations. This time I delve into community solar projects.
Solar projects are carried out at different scales. The most common are smaller roof-mounted residential projects that range from 3 to 20 kW. A 5 kW installation typically has about 17 panels. I discussed the financing of these projects in my previous post. The solar operations we often see in the press are large ground-mounted projects that cover acres of land and can involve many thousands of panels. These range from 1000 kW to 1 million kW (1000 MW) or larger and are designed to feed electricity directly into the electrical grid. They are often referred to as utility-scale projects. The largest solar farm in the world is presently the Tengger Desert Solar Park, built by China near Zongwei in the Ningxia region. This monster has a nameplate capacity of 1547 MW, cost about $1.1 billion, and covers a land area of 16.8 sq. milesThe center of the figure below shows a satellite view of this operation, which is located on the edge of the Mongolian Desert.


In NH, the largest operation at present is the substantially smaller 2000 kW operation built by New Hampshire Electric Coop. in Moultonborough. This has 7200 panels and is located on 24 acres (0.04 sq. miles) of land.
Between the small residential (owned by a single individual) and large utility-scale projects (owned and financed by utilities or large development and investment funds), we find community solar projects. These are often in the 50 to 500 kW range and are designed and built so that a group of individuals or organizations can benefit from solar power. Drawing from the concept of community gardens, these projects are often referred to as solar gardens.
The unique aspect of a community solar project is that, even though the solar project is built on a single piece of land and the electricity is fed into the grid at a single point, the members of the solar farm community are not directly wired to the project. Instead they are “virtually connected” – they are bound by a legal agreement and they reap the benefits of solar power without having to install solar panels on their property or residence.
This idea is based on the concept of group net metering. One of the members, the host, takes on the responsibility of hosting the project on their property and then shares the benefits with the solar community that the host assembles. Again, it is important to note that the members do not have electrical meters directly connected to the project, nor do they have to make changes to their electrical service: they benefit by getting their share of the solar benefits/credits as if they were connected. Their benefits are directly proportional to their allocated share of the project and the output of the solar array that is located elsewhere; however, the members cannot get benefits exceeding their total electricity consumption.
If you have the opportunity and are invited to join a solar community, this is a great way to become involved with solar without having to take on the burden of installing and owning of solar operation yourself. You might not have the funds for your own solar installation or a residence that is correctly positioned with a south-facing roof, but, as part of a solar community project, you could benefit as if you had your own installation.
It is always easier to understand how these concepts work by taking a look at an example. One of the first projects of this type in NH was the 164 kW Tolemac Solar project  that was installed by Frank Grossman on his property in Hollis, NH. This project went live in January 2017.
I had the opportunity to visit the project last year and to chat to Frank. In the process, I learned more about the project and what was involved in getting it up and running. Frank Grossman is an interesting guy and has been in the tech business for many years and has started up and sold several companies. He is driven to make a difference in the world and he has spent the last few years committing his own time and money to ideas that he considers to be important, such as solar power and high energy efficiency buildings.
Some years ago, Frank decided to install a solar system, but he wanted to make an impact and install a system larger than for just his residential use. He opted to build a 164 kW facility with 507 panels on his property (see the photo below for an aerial view of the completed array.) Frank certainly didn’t need this size operation for own needs (a typical residential system is 3 to 10 kW in size), so he assembled a group of 21 neighbors, friends, and local non-profits to benefit from his solar project. This “solar community” assembled by Frank benefits from the renewable power that his Tolemac project generates. The members are not wired to the project so there is no need for them to be adjacent or even nearby the project. In fact, one of the Tolemac community members is 15 miles from the Tolemac project. They just had to be members of the same utility—in this case, Eversource—and not getting their electricity from a competitive supplier. For the community members, this was an easy and straightforward decision. They had to sign a short legal agreement and, after sharing their electricity bills, they get quarterly checks for their prorata share of the electricity generated from the project. “It couldn’t have been easier”, said one of the members.


However, for Frank it was anything but easy. He provided the funds to build the array, he managed it, and dealt with the very complicated regulatory and administrative issues that accompany a first-time project of this sort. He worked with the utility, filed the paperwork, dealt with delays and obstacles, and worked hard to get local ordinances in Hollis changed so that the project could move forward. For Frank, this was a two-year journey and he learned a lot of lessons along the way. The most important was the need to educate a large group of stakeholders, which included not only the Tolemac community members, but also his neighbors and townspeople, the Town Planning Board, and the various lawyers he employed. He also had to work with the utility to reroute and upgrade the local electrical grid near his home. This was an expensive upgrade and involved the installation of 10 new utility poles.
Frank is the owner of the system and his motivation for this project was altruistic. He wanted to make a difference and his community members are subscribers. They do not own a share of the system: they simply receive the benefits from his project and enjoy lower electricity prices as a result. Frank has taken on all the risk, he paid for the system, he did the hard work, and he now keeps track of the administrative details. He gets paid by Eversource for the electricity sent into the grid and then sends out checks to his community for their agreed share. A total of 45% of the net-metering benefits are paid out to members. The rest is income to the project that is used to offset the original cost of investment. The installed cost of the Tolemac project was $3.21/Watt and, at the time of installation, the projected payback was of the order of 13 years.
Frank’s project generates about 250 MWh per year: compare this with a 5 kW residential system that generates ~6.5 MWh per year. Now, because the Tolemac project is larger than 100 kW, it is considered a large generator in NH and, as such, does not get all the net-metering benefits of smaller residential projects (see my earlier post for net-metering details for smaller residential solar projects). The Tolemac project only gets credit for electricity produced at the default rate and none for distribution and transmission costs. Solar projects that are less than 100 kW in size get credit for the electricity generated at the default rate, as well as the other kWh-based charges such as transmission and distribution costs. The table below shows a comparison of the net-metering benefits of small (<100 kW) and large (>100 kW) projects in NH. Based on present Eversource rates (April 2018), a smaller residential project would get paid 13.36 c/kWh for electricity exported to the grid. The Tolemac project gets a much smaller amount and presently only earns 7.90 c/kWh. An additional source of revenue for the project is the sale of solar renewable energy credits. The price of these varies and is presently of the order of $15 per 1000 kWh of solar energy produced.


There are several such solar projects located through New Hampshire and they are becoming increasingly important. The Peterborough project I wrote about previously is essentially a community solar project but, in this case, the community is various municipal buildings in the town of Peterborough. Solar power is generated at the municipal wastewater treatment facility and, through a group net-metering arrangement, the benefits are shared with the treatment facility and other town buildings. The 1000 kW solar installation on the capped landfill in Milton, NH (see photo below), is also a community solar project.


Group net metering is not just reserved for solar power. It is a concept that can be applied to other forms of renewable power, such as hydro. I will discuss these types of projects in a future blog post.
In the meantime, enjoy your solar benefits if you have your own system or are part of a solar community, but, even then, remember to turn off the lights when you leave the room.
Mike Mooiman
Franklin Pierce University
mooimanm@franklinpierce.edu

Tuesday, September 19, 2017

Solar Power in NH – Part 5 - Financing a Residential Solar System in New Hampshire

In this post, I take a closer look at funding a residential solar photovoltaic system in New Hampshire. Solar power has received a lot of coverage recently because the State rebates for new solar systems have been halted due to a lack of money in the Renewable Energy Fund that is set aside for this purpose and there have also been changes in the net metering regulations. The key point I want to make in this post is that there are still a lot of good reasons to install solar in NH - the net metering changes and the lack of a state rebate should not deter you.
Among the many good reasons to install solar on your home in NH are the following:
  • Electricity prices in NH are high and the production of your own solar power will provide you with some protection from further increases;
  • There is a generous federal investment tax credit on the installed cost of your solar system;
  • You have the ability to earn money through the sale of renewable energy credits (RECS);
  • Net metering of electricity in NH means that you get credit for the excess solar generated electricity that you feed into the grid during the daylight hours and you only pay for the net amount of electricity that you draw from the grid;
  • NH state rebates on the costs of installed solar might become available again in the near future.
In this post, I look at a typical system and figure out how these incentives come into play so that your solar system will eventually pay for itself over time. For my calculations and the rest of this discussion, I have assumed that a homeowner installs a 5 kW solar system (about 17 panels) at an installed cost of $15,000, which would produce 6500 kWh per year, and that the homeowner uses about 600 kWh/month (7200 kWh/year) of electricity at a rate of $0.16/kWh. I have also assumed that the homeowner lives in an area where there is a property tax exemption for installed solar. (See the NH Office of Energy and Planning website for a list of NH towns with property tax exemptions for solar installations.)
One of the most important incentives for residential solar systems is the federal investment solar tax credit. This program provides you with a tax credit of 30% of the installed cost of your solar system. This program is in effect until 2019, but the tax credit begins to decrease in 2020 and, beyond 2021, the program has not been renewed and it is possible that it will no longer be available in the future.
Another good incentive is the rebate provided by the NH Public Utility Commission (PUC). Until recently, a homeowner could receive up to $2500 from the Renewable Energy Fund administered by the PUC.. However, this program is presently on hold as has been reported in the press. The program has been a popular one and, owing to the flood of applications, the PUC has had to cease approving projects and awarding rebates until they know how much money they have to work with. The funds for this program come from Alternative Compliance Payments paid by the utilities. As noted in a previous post, these vary from year to year and the funding available from this source is unpredictable. I expect that the PUC will go back to funding projects, but not all installations will be able to get rebates and I expect the rebate amounts to be smaller. For the purposes of my analysis in this post, I have assumed that the rebate is not available. If you are fortunate enough to be awarded a state rebate in the future, this will just improve the cash flow and payback on your solar investment.
Another incentive is the sale of RECs, which I discussed in a previous post. Solar has a special carve-out class – Class II – in the NH Renewable Portfolio Standard: for every 1 MWh (1000 kWh) of electricity you produce from your solar system, you can sell the equivalent REC. Class II solar RECs are presently selling for between $15 and $20, so, if your 5 kW solar system produces 6500 kWh/year, you could sell your six RECs for  $15 each to earn an additional $90. However, it is important to keep in mind that, as a small producer of RECs, the administrative and commission costs involved in tracking, verifying and selling those RECs could be of the order of $50, eating up a good amount of  your REC income. To benefit to a greater degree from REC sales,  homeowners would need higher RECs prices or should install a larger solar system to produce more RECs to defray the administration costs.
Net metering is an important incentive but as of June 2017, new regulations were issued by the NH PUC, which reduced some of the monetary benefits of net metering. With the new regulations, homeowners, whose exports of power exceed their consumption, will receive a reduced rate for their monthly net exports. I discussed this in detail in my last post and determined the rate reduction would be of the order of 20%. Homeowners with monthly net imports will continue to pay the retail rates for their net imports but the non-bypassable charges are treated separately. These charges, which include the system benefits charge, stranded cost recovery charge, and the state electricity consumption tax, are of the order of 0.5 cent/kWh and will be billed for every imported kWh no matter how much electricity is exported. The homeowner will not receive any credit for these charges for their exported kWhs.
To get a better appreciation of net metering at work, consider the following chart which shows the projected usage and solar generation for that typical NH home with a 5 kW solar system. The chart was prepared using generation data from the PVWatt calculator and residential load profiles for a NH residence from the Department of Energy. The graph shows monthly usage and generation and is different from my graph in my previous post which charted hourly data. The monthly view is important one as net metering is presently carried out on a monthly basis. The data shows that in the winter months, October to March, electricity demand is greater than solar power generation so there will be a net import of electricity into the home in those months. Homeowners would pay retail prices for those net monthly electricity imports. For the summer months, April through September, the amount of solar generation is greater than usage so there will be a net export of electricity and the homeowner would earn the lower export rates for their net exports during those months. My calculations indicate that, for the NH home we are considering in this post, a 5 kW solar system would save a homeowner $990 in electricity charges over the year. This is about $57 or 5% lower than the savings that would have been expected from net metering before the recent set of changes to the net metering regulations.

With these incentives in mind, let’s look at funding a solar system. There are three basic ways that homeowners can finance their solar systems:
  • The first, and very popular with frugal northern New England Yankee types, is simply to buy the system outright using savings. The system then pays for itself through electricity savings, the federal solar tax credit, REC sales, and, if available, the NH rebate.
  • The second is taking out a loan from a bank to fund the solar system and paying it back over a number of years. For the purposes of my calculations, I have assumed a $15,000 home equity line of credit (HELOC) with an interest rate of 6%, no down payment, payable over 15 years, and that the interest payments on the loan are tax deductible.
  • The third approach is having a solar company pay to install the panels on your roof and you sign an agreement, known as a power purchase agreement (PPA), to purchase electricity at a reduced rate for an agreed number of years (typically 15). In a variant of this approach, known as a solar lease, you can end up owning the system after a number of years. The advantage of this approach is that there are no upfront costs, no bank loan, and you benefit during the period of the agreement from reduced electricity rates. However, in this approach, the solar company makes the investment and benefits from the incentives.
Each of these approaches have their respective pros and cons and will work for you in different ways – what is right for you depends on your savings and financial situation and how long you plan to be in your home. I took a look at each option and calculated the annual cash flows  over 15 and 20 years to compare how much money each of these options would put into your pocket. My key assumptions are that the electricity price is currently 16 cents/kWh and will increase by 2%/year, that RECs are $15 each and prices will decrease by 5%/year and that the administrative costs involved in selling RECs are $50/year. The results for all three financing options are plotted below.
The outright purchase option is plotted in blue. The initial outlay of $15,000 for the system is offset in the first year by the federal solar tax credit, the electricity savings of $990/year and REC sales of $90 (offset by the associated administrative costs and commissions). Every year thereafter, the initial capital outlay is offset by the annual electricity savings and REC sales. Early in the ninth year, the cumulative cash flows go from negative to positive. This is the payback point, so the payback period would be just over 9 years. After this, the investment is cash flow-positive and, by Year 15, the cumulative cash flow from the project is almost $7000. By Year 20, it will have risen to almost $14,000. Another way to view this financing option is that it is equivalent to making a $15,000 investment and earning a 8.7% return over 20 years, a return which, for most of us, is very hard to find these days. (Should the NH rebate become available, the project cash flows would be larger, the payback period would improve to 7 years, and the 20-year investment return would increase to 11.7%.)
Should you not have $15,000 available for a solar investment, you could consider taking out a loan for the solar system. There are a number of solar-system-specific deals available from NH lenders but, for this post, I have assumed a simple 6% home equity loan paid back over 15 years with tax-deductible interest. The cash flows are shown in orange in the chart above. The attraction of this option is that there is no initial cash outlay on your part and you benefit right away in the first year from that $4500 federal tax credit, which immediately puts that nice stack of money in your pocket. Going forward, you then have annual benefits of electricity savings and REC sales, but you also have loan payments of approximately $1520 per year. In this scenario, your annual loan payments are higher than your annual savings and that, over time, eats into that Year 1 tax benefit. By Year 15 your loan has been paid off and, from that point on, you benefit fully from your electricity savings and REC sales. By Year 20, the cumulative cash flow from the project will have risen to ~$8100.
The third option, popular with many homeowners in other states, is to have a solar company install a system on your home and then sign an agreement with them to purchase the produced solar power at a rate lower than the prevailing utility rate. For this case, I have simply assumed no outlay on the part of the homeowner and they get to purchase solar generated electricity for 13 cents/kWh, instead of 16 cents/kWh, giving an annual saving of ~$200. The cash flows for this option are shown in green - the cumulative cash flow from the solar project by Year 15 is approximately $3400; by Year 20, it will have risen to $4700.
Should you have different numbers and want to consider different system sizes, interest rates, or loan periods, feel free to use the Excel-based calculator that I have posted on this site and see what works for you. Please use the calculator as a guide only. Collect as much information as you can from other sources, get multiple quotes for your solar system and quiz each solar company on their payback calculations. Ultimately the more informed you are, the better your decision is likely to be. If you have questions or comments about the calculator, please reach out to me via email.
I have summarized the 15- and 20-year cash flow information for the three options in the table below. If we look at the cash flows for the project, it is clear that the best option, assuming that a homeowner has the funds, is the outright purchase of the system. The loan option, especially after 20 years when the loan has paid off, starts looking good as well. The least favorable option, over the 20-year view, is the PPA; however, if you don’t have the funds, and don’t want to take out a loan, it might be an interesting possibility.

Many of us don’t like home-investment projects with long payback periods or lengthy loans unless we are committed to staying in our homes for an extended amount of time. A report from the Lawrence Berkeley National Laboratory indicated that solar panels do increase the value of your home, but this only applied to homes with an owned solar system and not to homes where a solar company owned the system. So, if you pay to install a solar system and sell it before reaping all the long-term energy savings, you should gain from a higher sale price.
Take a look at the solar calculator I have developed and, if you have not done so already, seriously consider installing a solar system on your home. It will put money in your pocket over the long term, it will partially shield you from future electricity rate increases, and, most importantly, you will be helping to reduce greenhouse gas emissions from the burning of fossil fuels. In the meantime, while you are contemplating installing a solar system, remember to turn off the lights when you leave the room. 
Mike Mooiman
Franklin Pierce University
mooimanm@franklinpierce.edu

Tuesday, September 12, 2017

Solar Power in NH Part 4 – Residential Solar Output and Net Metering

In a previous post, I pointed out that there are many reasons for installing solar in New Hampshire and that residents should be taking advantage of these and benefiting from energy delivered daily by the sun to our homes. In this post, I take a look at a typical NH home with an installed solar system and examine its electricity consumption profile and its generation of solar power.
Let’s consider a typical NH home that uses about 600 kWh/month (7200 kWh/year). Such a home uses approximately 20 kWh/day, but this is highly variable and depends on the season, the outside temperatures, the number and nature of the installed electrical devices, and whether there is someone at home during the day.
Let’s assume that this home has installed a 5 kW system solar system (about 17 panels), which would (according to the NREL PVWatts calculator) produce about 6500 kWh/year or about 18 kWh/day. On an annual basis, this is a close match between consumption and generation. However, solar electricity generation only occurs when the sun is up and, as pointed out in a previous post, is highly dependent on the time of day, temperatures, and the amount of cloud cover. As a result, there is a significant mismatch between the hourly solar power generation and the consumption profiles, as shown in the figures below for typical winter and summer days in NH. The hourly consumption data were generated from a smart meter at a NH home and the hourly generation data from the PVWatts calculator.

The daily electricity consumption profiles, shown in blue, are different in winter and summer. In winter, there is an early morning bump up in electricity use as the house is warmed up, showers are taken, and breakfast is made. It then it drops off until the evening, when the home is heated again, lights are turned on, cooking is done, and the TV is turned on. In the summertime, we don’t see as much of a bump in electricity use in the morning because home heating is not required, but towards the end of the afternoon, the air conditioner gets turned on, along with cooking, lights, and TV to produce a significant increase in electricity consumption. (For this particular home, the AC unit is clearly used very frugally because the late afternoon/evening AC bump up is typically larger.)
Overlaid on both charts is the generation of electricity from the solar panels. For both dates, a sunny day was chosen and it can be seen that, for a most of the daylight hours, the system generates more electricity than the home is using. In this case, the excess energy is fed back into the grid and is available to be used by someone else nearby who does not have an installed solar system. It is this excess electricity, produced from a multitude of solar systems in New England, that allows the coordinator of the electric grid, ISO-NE, to ratchet down the generation of electricity from large fossil-fuel generation plants during this period. However, as soon as the sun sets and solar electricity production plummets, these same plants need to be ready to turn on electricity production to keep on the lights in New England. This highly variable generation profile presents challenges for utility-scale electricity generation in these days of large-volume solar power generation.
This data is notable because it shows that approximately 15 kWh, ~70% of the solar electricity produced during the daylight hours, makes its way to grid because the home’s electricity consumption is low during the period of peak solar power production. Using generation data from the PVWatt calculator and residential load profiles for a NH residence from the Department of Energy, I did the same hourly analysis for a whole year and it turns out that more than 60% (!) of the generated solar power would be exported from the home and energy use profile I chose. For a home using more electricity, say 9500 kWh/yr, the exported amount drops to 51%. For homes with larger solar systems, the amount could increase to above 70%. It is not obvious, but it turns out that even if, on a daily (or monthly) basis, solar power production is short of a homeowner’s needs, most of the electricity generated by the solar system makes its way to the grid.

During the period of excess solar power production, the homeowner is delivering electricity into the grid and building up an electricity credit that can be used to offset their consumption during the nighttime hours. This, basically, is how the concept of net metering works – the homeowner gets credit for excess electricity generated and is only billed for their net consumption. In this example, the home consumed 20 kWh during the winter day but generated 19 kWh from their solar system, so the homeowner would only be billed for their net consumption of 1 kW (if it was done on a daily basis). For the summer day, the home used 22 kWh but produced 24 kWh, to earn the homeowner a credit of 2 kWh. Net metering is typically done over a month so the daily credits and debits are totaled and, at month end, the ratepayer is responsible for paying any shortfalls or enjoying any credits that they can then apply the following month’s electricity consumption.

However, net metering is changing. The approach of just netting the consumption and generation of kilowatt hours and being billed for the monthly difference at retail rates is being reconsidered. There has been a lot of pushback from utilities across the country because they are concerned that net metering customers do not pay their fair share of the transmission and distribution costs that are built into rates. Homeowners with larger solar systems, who generate more electricity than they consume, end up not paying for transmission and distribution(T&D) costs but enjoying the privilege of been connected to the T&D grid and of drawing on it when the sun sets. Net metering is under review across the country and in NH the Public Utilities Commission (PUC) recently decided that the matter was an important one, that an interim change was necessary and further study was warranted.

The PUC issued new net metering regulations in June 2017, and, as a result, homeowners installing new solar systems could see a reduced benefit from net metering. If a home imports electricity - calculated by the monthly netting of imported kWh and exported kWh - the home owner will pay the full retail rate for their net usage. This includes all components of their electrical bill which includes the energy service charge, transmission and distribution charges. Other charges such as the system benefits charge, stranded cost recovery charge, and the state electricity consumption tax (the so called non-bypassable charges) will be billed for every kWh imported and the homeowner will not receive any credit for these charges for their exported kWh. However if, on a monthly netting basis, a home exports electricity,  solar system owners will receive for the net exports the full retail rates for the energy service and transmission charges but only 25% of the distribution charges and no credit for the non-bypassable charges.

In the table below I have calculated the implications of these changes for a typical Eversource retail customer in NH. The second column shows the components of present retail rates for electricity which total up a retail cost of electricity of 18.1 cents/kWh. The last column shows what the homeowner would be paid if they export more than they use after the recent net metering changes. The export rates take into account full credit for energy services and transmission charges, 25% of the distribution charges and no credit for the non-bypassable charges. My calculations show that the homeowner with monthly exports would receive 14.5 cents/kilowatt hour for their net exports which is a 20% reduction off the retail rate for imported electricity. Of course, the exact reduction depends on the particular utility and their retail rates in effect at that time. These changes will largely impact homeowners who install larger solar systems that deliver net monthly exports of electricity and will extend the payback period for their solar investment.

It should be noted that these changes do not impact homeowners who already have installed solar systems. They will continue to benefit from the strict monthly netting of consumption and generation and they will receive the benefit of full retail rates for exported electricity until 2040.

In my next post, we will take a look at the same home and look at the financing of a solar system and the importance of the various incentives, including the net metering changes, in generating a return from a new solar installation in NH.

Until next time, remember to turn off the lights when you leave the room. 
Mike Mooiman
Franklin Pierce University
mooimanm@franklinpierce.edu

Tuesday, September 5, 2017

Solar Power in NH – Part 3 – Ranking NH’s Solar

This is my third installment dealing with solar power in NH. In the first two posts, I provided some basic concepts about solar power, as well as information about NH solar potential and the large solar farm in Peterborough. As I drive around New England, I see solar installations popping up everywhere, especially in Massachusetts and Vermont. Rhode Island recently passed new laws that will continue to support solar in a big way so I thought it would be useful to do a comparison between the various New England states to see how New Hampshire stacks up.
The first information I sought out was how much installed solar each state has. There are several sources for this information, which have different degrees of reliability, ease and cost of accessibility, and different bases for the rankings. Direct comparison of the various sources is complicated by the different ways of rating the power outputs of solar plants. As explained in my previous post, solar photovoltaic (PV) installations produce direct current (DC) electricity and the rating of solar PV operations is often given as the combined DC output capacity, in kilowatts (kW) or megawatts (MW) DC, of the panels under the standard test conditions of 1000 W/m2 irradiation and temperature of 25oC – conditions known as one peak sun (see an earlier post for an explanation of irradiation and the peak sun hour concept). To feed electricity into the grid, the DC electricity needs to be converted into alternating current (AC) through a device called an inverter. During this conversion, there are losses through the electrical system and wiring. These losses are typically of the order of 5 to 10%, so the peak AC output of a solar system, in in kW or MW AC, can vary from 90 to 95% of the DC rating. However, there are also performance losses due to dust on panels, degradation of the panels over time, and elevated temperatures. In my calculations, I typically assume that the peak output of AC electricity from a solar system is about 80% of its DC rating.
In searching for installed solar capacity information, the most useful I found was the 2016 data from ISO-NE, which is included in the table below, along with the 50 state ranking carried out by the Solar Energy Industries Association (SEIA). I have also included a chart from the ISO-NE Final 2017 Forecast that shows the growth in New England PV installations since December 2013. The ISO-NE data (reported in MWAC) shows that Massachusetts is clearly on top of the New England installed solar rankings, followed by Connecticut and Vermont. Massachusetts is also ranked #7 out of the 50 states in installed solar capacity. California, as one would expect, is ranked #1. In the 50-state ranking, NH is presently in 33rd position.


Source: ISO-NE

Even though Vermont’s installed solar capacity is a small fraction of that of Massachusetts, I was still impressed at how much solar they have installed, so I calculated the installed solar capacity on a per-person basis and generated the chart below. In this ranking, Vermont rises to the top, with installed solar capacity of 318 W AC per capita. To put this into perspective, this means that Vermont has installed the equivalent of more than one solar panel for each person in the state (modern solar panels have a DC rating of 300 W and an AC output rating of ~240 W (after losses)). This is a little lower than the California figure of ~370 WAC, but I’m still impressed.

 Source: ISO-NE and  Census.gov

In terms of installed solar, NH is very much at the back of the pack, but there are other solar ranking systems out there. I am a fan of the state rankings carried out by the folks at Solar Power Rocks. They order states on the basis of regulations, incentives, investment returns, and cost of electricity (among other factors that are supportive of solar power). In their ranking, which I have shared below, NH places fairly high, coming in at #10. The other New England states, MA, RI, VT and CT, also appear in the top 10, while Maine is found in 23rd position.
The specific scorecard for NH is reproduced below: it is clear that with a “B” grading, NH has a lot going for it in terms of support for solar power. The factors in NH’s favor include:
  • High electricity prices;
  • Net metering;
  • The Federal solar tax credit – presently 30% of the cost for installing a PV system;
  • Production credits through the sale of renewable energy credits;
  • State rebates on the costs for installing solar.
There has been a fair amount of news recently about the NH state rebates available from the Public Utilities Commission. The program is presently on hold due to its record demand and concerns about sufficient funding. Nevertheless, there is much in favor in terms of installing solar in NH, and we should be taking advantage of this. In my next posts, I will take a close look at how these factors play out in considering whether to install solar on your home in NH. So, until next time, remember to turn off the lights when you leave the room. 
Mike Mooiman
Franklin Pierce University
mooimanm@franklinpierce.edu

Click on this link to receive email notifications for Energy in New Hampshire updates

Sunday, August 6, 2017

Solar Power in New Hampshire – Part 2

Today we see solar power and especially photovoltaic (PV) technology everywhere: it is powering homes and businesses, roadside warning signs, large community applications, and even larger grid-scale operations. PVs generate electricity directly from sunlight using semiconductor technology that is built into the PV panels. The ever-increasing scope of PV applications ranges from small devices that generate tiny amounts of electricity used to power calculators (outputs in the milliwatt (mW) range), to one- or two-panel systems generating 100 to 300 watts (W) to charge cell phones and provide light (often installed in developing countries), to 2 to 50 kilowatt (kW) systems that power homes and businesses, all the way to grid-scale solar farms with ratings as high as 1000 megawatts (MW). Below are photographs of some solar installations that I have recently observed.


There are two kinds of PV systems: grid-connected and off-grid systems. In grid-connected systems, the excess AC (alternating current) output of a solar operation is fed into the electrical grid to supplement the power produced by other power plants. These operations usually do not include any storage so they can only generate and supply power to the grid during daylight hours. The supply from these operations is therefore highly variable: low in the mornings and afternoons, high at midday, and cloud cover significantly reduces their output. The electrical grid needs to be managed to adjust to this variable output. Most smaller residential solar systems in the US are grid-connected, and range from large utility-scale systems to smaller home-based units in which electricity produced during the day in excess of that used by the homeowner is fed back into the grid. These systems are often bidirectional: during the day, electricity is supplied to the grid; during the night, when no solar electricity is produced, power is drawn from the main electrical grid.

The other type of solar system is not connected to the main electrical grid. These are known as off-grid systems and are typically found in off-grid homes or in remote areas far away from the grid in developing countries. These usually incorporate batteries so that any excess energy can be stored for use during evening hours. During the day, the sun generates electricity that is used to power the site, while excess electricity is stored in batteries to provide power for the evenings. Off-grid systems are sometimes combined with other means of electricity generation, such as diesel generators, that can provide backup power during cloudy conditions or when the batteries are depleted. These are referred to as hybrid systems.

Some solar systems combine grid-connected and off-grid approaches. These have battery storage, but are also connected to the grid. Such operations generate some or all of the electricity needed by the homeowner or business during the day and any excess is stored in the batteries (as opposed to sending it out to the grid); however, the grid connection is there to provide any shortfalls in power production from the solar panels or when the batteries are depleted. These systems offer the best of both worlds—they produce and use renewable energy so their electricity purchases from the grid are reduced, but the grid is there as a standby to cover any shortfalls. Solar systems utilizing the much-touted Tesla Powerwall battery systems are of this type and I anticipate that we will see many more of these systems in the future.

In the energy field, one needs to be sure to understand what is meant by the rating of a power plant, whether it be a small residential solar system or a nuclear power plant. For most power plants, say the 1244 MW Seabrook nuclear power plant in NH, the power rating refers to the output of AC electricity. In this case, it is easy to calculate how much electricity a power plant would generate over a certain time period. For example, if the Seabrook plant was running at its rated output, uninterrupted for 24 hours, the yield of electricity would be:

1244 MW x 24 hours = 29,856 MWh.

Solar system ratings are different. The PV modules produce direct current (DC) electricity and the rating of solar PV operations is given as the combined DC output capacity of the panels under the standard irradiation condition of 1000 W/m2 at 25oC – conditions known as one peak sun (see an earlier post for an explanation of irradiation and the peak sun hour concept). As I showed in my previous post, the irradiation levels are only close to one peak sun at around noontime. A solar panel will therefore only produce its rated output of DC electricity for a short period around midday; at other times, the irradiation is lower and the output is commensurately lower. But DC electricity is not particularly useful for powering our existing homes and businesses: we have to convert that DC current to AC to operate our appliances, lights, and devices. During this conversion, there are losses through the electrical system and wiring. These losses are typically of the order of 5 to 10%. There are also performance losses due to dust on panels, degradation of the panels over time, and  elevated temperatures.

Intuitively, one would expect hot sunny days to be ideal for solar power generation, but an aspect of PV technology not often appreciated is that the electricity output of PV panels actually decreases as the temperature increases—by approximately 0.5%/oC. When temperatures are high, panels operating in the New England area can often reach surface temperatures of 140oF (60oC), which can cause a 10 to 12% decrease in performance. This problem is even more extreme in the sunny environments of Nevada and Arizona, where the choice of solar power may seem obvious. Furthermore, when clouds roll over the skies during the day, we can also expect a big decrease in electricity production.

Between the conversion, dust, degradation, and temperature losses, clouds, and the limited number of peak sun hours during the day, the AC output of a solar installation is, in fact, a small fraction of its DC rating. For example, the PV calculator from NREL shows that a DC-rated 1 MW solar plant in NH will produce, on average, 3.6 MWh of AC electricity per day. A 1 MW AC-rated fossil-fuel plant operating for 1 day would produce 24 MWh—almost seven times more electricity, This is an important distinction that is often forgotten. Size is important in energy production, but it is important to understand what the rated size means.

Speaking of size, the largest solar plant in NH is presently the 942 kW operation that is powering the wastewater treatment plant and other municipal buildings in Peterborough. Here are some interesting specifics about this plant:
  • It cost $ 2.4 million. Half of the funds came from the Renewable Energy Fund administered by the NH Public Utilities Commission; the remainder was funded by the developer and builder of the solar array, Borrego Solar.
  • The array is built on land previously covered by a holding pond at the wastewater treatment pond.
  • The plant consists of 3088 Canadian Solar modules, each with a rating of 305 W.
  • The project went online in November 2015.
  • The benefit to Peterborough is that there was no upfront capital investment and, per the power purchase agreement, the town buys all the electricity produced by the solar array at a cost of 8c/kWh (with a 1%/year increase for next 20 years). Previously, the cost for electricity from the utility was 14c/kWh. It has been estimated that this solar installation will produce savings of $ 250,000 to $ 500,000 over the 20-year term of the agreement.
  • Borrego Solar gets to sell the associated renewable energy credits and benefits from the 30% federal tax credit.
  • Based on the NREL PVWatts calculator, the annual output for the Peterborough system should be 1165 MWh; however, as noted above, the output will vary from year to year depending on the irradiation conditions, temperatures, and amount of cloud cover. In 2016, the annual electricity production was 1280 MWh, which was a little better than calculated.
  • The performance of the plant can be monitored online through a useful solar dashboard link.
Aerial View of Peterborough Solar Plant. Source: Peterborough

The chart below shows the panel temperatures and solar radiance levels for one recent day, 7/20/17, at the Peterborough solar plant. Even though the ambient temperature only reached 90oF, the panel temperatures rose to as high as 140oF. The periodic dips in the solar power and irradiance levels are due to passing clouds.


In my next post on solar power in NH, I will look at how the state is doing with respect to solar installations. I will also highlight some recent changes that NH homeowners who are considering solar should take into account.

Until next time, remember to turn off the lights when you leave the room. 

Mike Mooiman
Franklin Pierce University
mooimanm@franklinpierce.edu