In previous posts, I provided some introductory
information about the Renewable Portfolio Standard (RPS) in NH, as well as specific
information about Renewable Energy Credit (REC) trading and pricing. In
this post, I take a closer look at the money flows in the RPS program and what
it costs NH ratepayers.
But first a quick review. Electricity providers in NH are
required to source a certain percentage of their electricity from renewable
energy (RE) sources by purchasing RECs generated by RE operations. There are
different classes of RE and obligations for each class. RECs are a tradable
commodity: their prices depend on supply and demand, which are driven by the
various RPS requirements in each state. There is a upper limit on REC prices: as
noted in my
previous post, the Alternative Compliance Payment (ACP) sets
a price cap on what the utilities
are required to pay for each REC. If prices of RECs are above the ACP, the
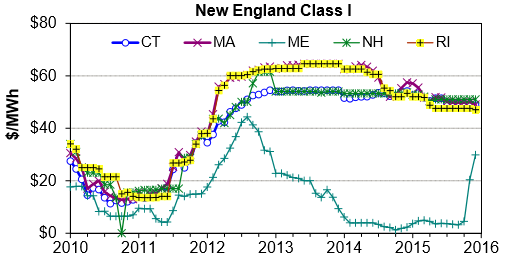
utilities are obligated to pay the ACP instead. When there is a shortage of REC in a specific
class, their prices quickly rise to the ACP value set for that class; when a
surplus occurs, REC prices can drop way below the ACP.
The flows of money (black) and RECs (green) within the RPS
program are shown in the figure below. NH electricity suppliers, which include
the four electrical utilities (Eversource (PSNH), Liberty, Unitil, and the New
Hampshire Electric Cooperative) as well as the competitive electricity
suppliers (for example, Constellation and TransCanada Power, among many others),
can purchase RECs from NH RE plants or from RE generators in other states, as
long as the generators meet the NH class requirements and are registered with
the NH Public Utilities Commission (PUC) for that class. Some utilities have entered
long-term contracts with RE generators to
buy electricity and the associated RECs directly. An
example is the power purchase agreement between Eversource/PSNH and
the Berlin Biomass facility that was put into place in 2011. These power
purchase agreements have to be approved by the PUC.
When there are insufficient RECs available to meet the various class requirements or if REC prices are higher than the NH ACP, electricity suppliers are obligated to pay the ACP to the PUC. These payments go into the Renewable Energy Fund, which is used to support RE projects in NH. These projects, in turn, generate more NH-based RECs, which can then be purchased by electricity suppliers in NH.
Ultimately, the RPS program is paid for by ratepayers or customers of the various electricity suppliers because all monies paid out by electricity suppliers, either to buy RECs or in ACP payments, are bundled into their overall costs, which then find their way into the rates that the supplier charges its customers or ratepayers.

The money for the RECs is paid directly to the RE generators and is a
valuable source of revenue for them. The wholesale price for electricity in NE is typically about $30/MWh, so the
additional revenue from RECs, which can range from $10 to $55/MWh, is a very
important part of their income. In fact, most RE projects could not survive
without the REC income and, for many, it comprises the larger part of their income.
These RECs
are, in effect, subsidies for RE generation. It is these subsidies that cause
opponents of the RPS a great deal of angst: they view these subsidies as
picking winners and losers in the energy market – the winners are subsidized RE
generators over fossil-fuel based losers. However, another way to view these
subsidies is to consider that they provide stimulus for innovation. We all live
our very modern and connected lives due to innovation that has been driven by
public policy. Just think of improvements such as microprocessors, vaccines,
and the internet, all of which had their origins in government-funded research
that was paid by our tax dollars. The RPS is similar: it is a public policy
that provides subsidies that allow innovation in the energy field to take place;
once technological advancement has proceeded to a certain point, the new
technologies can stand on their own merits and compete head-to-head with
non-renewable technologies.
One hitch with RECs being a revenue source is that it
complicates the wholesale markets for electricity. Revenue from RECs is often much
greater than that from the sale of electricity: RE generators want to sell
power, regardless of how low electricity rates drop, so that they can generate
the associated RECs and earn that income. There are times when RE operations,
especially the larger wind operations in New England, will bid into the electricity
market at zero or even negative prices, just to earn the REC-based revenue.
This can cause market distortions and complicate
the economics for non-RE plants, such as nuclear, that are not similarly subsidized.
Let’s turn our attention to those ACP payments. As noted
previously, when there are insufficient RECs available to meet the various
class requirements or if prices are higher than the ACP, the utilities are
obligated to pay the ACP. That money goes into the Renewable Energy Fund, which
is used to supplement funding for RE generation by state and local governments,
commercial and industrial enterprises, and smaller residential-based projects.
The Sustainable Energy Division of the PUC administers the
Renewable Energy Fund and runs two types of programs: a
rebate program and a grant program. The rebate program provides
direct financial support for commercial, industrial, and residential projects
involving the installation of solar photovoltaics (PV), solar hot water, and
wood-pellet furnaces. The grant program is a competitive scheme for the
installation of RE projects at commercial and industrial operations. There is a
rigorous selection process to determine which projects receive funding. The
focus of the grant programs changes depending on the particular RE needs. At the
moment, the preference is for thermal and small hydropower projects because
there are REC shortfalls in these classes and attention is required to get additional
facilities up and running to generate more RECs. Funding and disbursement of
funds through the rebate and grant programs are reported
annually by the PUC. This makes for informative reading if you are
interested in these matters.
As can be seen in the figure below, ACP payments fluctuate
significantly from year to year depending on a host of issues, including the NH
RE requirement (which can ramp up annually), REC prices in other states,
eligibility of NH RECs in other states, the number of RE facilities coming
online and adding their RECs to market, and operational issues, such as
shutdowns at larger RE plants. The ACP payments are typically of the order of
$1 to $4 million, but, in some years when there was a shortage of Class 1 RECs,
they were very high: in 2013, the total ACPs were $17.5 million; in 2011, they
exceeded $19 million. Over the past few years, those very high ACPs have abated
as the shortage of Class I RECs has subsided.

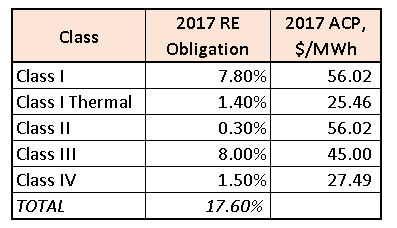
I took a look at the most
recent report of ACP payments and used the data, plus some
calculations, to generate the table below. Based on 2015 retail sales of
electricity and the prevailing ACP rates at that time, I calculated that if no
RECs were available in any of the classes, the total ACP payable would have
been ~$47 million. However, the actual ACP amount paid was only $4.2 million—9%
of the maximum payable— which indicates that the electricity suppliers were
able to source the difference (91% of their REC needs) from RE generators.

The data also show that, for Class I Thermal and Class IV,
more than half of the RE obligation was met by paying the ACP. For the other
classes, most RE obligations were met by purchasing RECs, indicating their
ready availability, for the most part, in these classes. It is this shortage of
Class I Thermal and Class IV RECs that has shifted the focus of the NH PUC Renewable
Energy Fund to promoting and supporting thermal and small hydropower projects.
Information on the ACPs is readily available, but,
interestingly, that for RECs and what the electricity suppliers pay for them is
not. This information is considered confidential and only manifests in the
rates that the suppliers charge. For a data geek like me, this is a little
disappointing, as I think more transparency would be useful here: we could
learn about the origins of the RECs being purchased and see how much is used to
support in-state and out-of-state projects. This information would also allow
us to determine exactly how much the RPS program costs NH ratepayers. As I
noted previously, the extra money paid for RE in the form of RECs or ACPs is
funded by rate payers via local electricity rates, but this begs the question: How
much does the RPS plan cost NH rate payers? A key piece of information—the
costs of the purchased RECs in the different classes—is missing.
Although this information is not directly available, I made
some assumptions, using historical REC
prices, and calculated that, in 2015, the costs of the ACP payments and REC were
of the order of $40 million. This is 2.2% of the $1.8 billion that was paid for
electricity by NH ratepayers (based on $160/MWh ($0.16/kWh) retail rate and 11 million MWh of electricity). This is in line with data calculated
by the Berkeley Lab, which
determined that RPS costs for NH were 2.7% in 2012 and rose to 3.2% in 2014.
My calculations were, however, carried out using the 2015 RE
requirement of 8.9%. As
we climb up to the 2025 level of 24.8% RE, we can anticipate that costs
will increase. Based on moderate electricity use and rate increases, I have
calculated that, in 2025, the costs of RPS compliance will be a maximum of 8%
of electricity rates, assuming only ACP payments, but are more likely to range
from 3% to 5%, depending on the availability and pricing of RECs over the next eight
years.
This post has taken a look at money flows in the RPS
program and seen how ratepayers ultimately subsidize RE projects through their
electricity suppliers purchasing RECs and paying the ACPs. The program
presently adds about 3% to NH electricity rates, but it can be viewed as an
important stimulus for innovation of RE sources as we, over time, deplete our
resources of fossil fuels.
In the meantime, do
your bit to reduce our needs for both renewable and fossil fuel-generated electricity
by remembering to turn off the lights when you leave the room.
Mike
Mooiman
Franklin
Pierce University
mooimanm@franklinpierce.edu


