Monday, August 19, 2013

Crossing Muddy Waters* - Trying to Understand Retail Propane Pricing - Propane in New Hampshire – Part 2


As a consequence of the upturn in natural gas recovery from shale gas deposits, a great deal of propane has been produced as a byproduct, so much so that the US is now exporting significant quantities of propane. However, here in New England we don't seem to be benefitting from this surge in propane production. In this week's post, I endeavor to understand why we pay so much for propane in New Hampshire. 

In my last post, Under Pressure, I presented some facts and figures about propane usage in New Hampshire. I pointed out that propane was a versatile fuel as it can be easily stored, it can be used for both heating and cooking and it is particularly useful in remote areas where there is no natural gas supply. I also presented data showing that propane usage in NH is higher than in the other New England states and that propane, on an energy output basis, is presently the most expensive fossil fuel in New Hampshire.

Before we dig into propane pricing, it is useful to understand the production, processing and distribution of propane. To do so, let's follow the fate of a propane molecule that is associated with a natural gas deposit down in Texas - as that is the origin of a lot of our propane supply here in New England. The raw natural gas drawn from a natural gas well can contain between 70 and 90% methane but also, depending on the deposit, between 0 and 20% of hydrocarbon gases like ethane, propane, butanes and sometimes longer hydrocarbon chain molecules, like pentanes and hexanes. There might also be 0 to 8% carbon dioxide, as much as 5% sulfur as hydrogen sulfide, some nitrogen and water, and a host of other minor level contaminants. The first processing step is the removal of any easily condensable material, like water and long-chain hydrocarbons. This is normally done close to the natural gas well. The gas is then pumped to a natural gas processing plant where sulfur, mercury, nitrogen, and carbon dioxide are removed. Our propane molecule is all the while being batted along these various separation processes following the methane.
 
The gas mixture is then subjected to a low temperature cryogenic process in which all the other hydrocarbons, like our propane molecule as well as natural gasoline, a mixture of pentanes and hexanes, isobutene, butane and ethane, are condensed into liquid, hence the term natural gas liquids or NGL. The methane gas, now free of the bulk of contaminants, is fed into a natural gas pipeline for storage or distribution. The mixed natural gas liquids, now known as Y grade, along with the propane molecule we are following, are then routed through a pipeline to the fractionation plant where the mixture is slowly warmed up and separated into various component fractions. First to be recovered is the natural gasoline fraction, followed by butane and isobutene and then, finally, propane and ethane are separated. Our propane molecule, along with the rest of the propane fraction, after the pummeling in the fractionation plant, is then pumped to large underground storage caverns in Mont Belvieu, Texas, which serves as the main distribution hub for propane throughout the country. Pricing of propane at the Mont Belvieu hub also serves as the basis for commodity pricing of propane used by energy traders in the US. As I mentioned in my previous post, propane is also a byproduct of the crude oil refining processes: propane from Gulf Coast crude oil refining operations can also be piped to and stored in the Mont Belvieu depot.
 
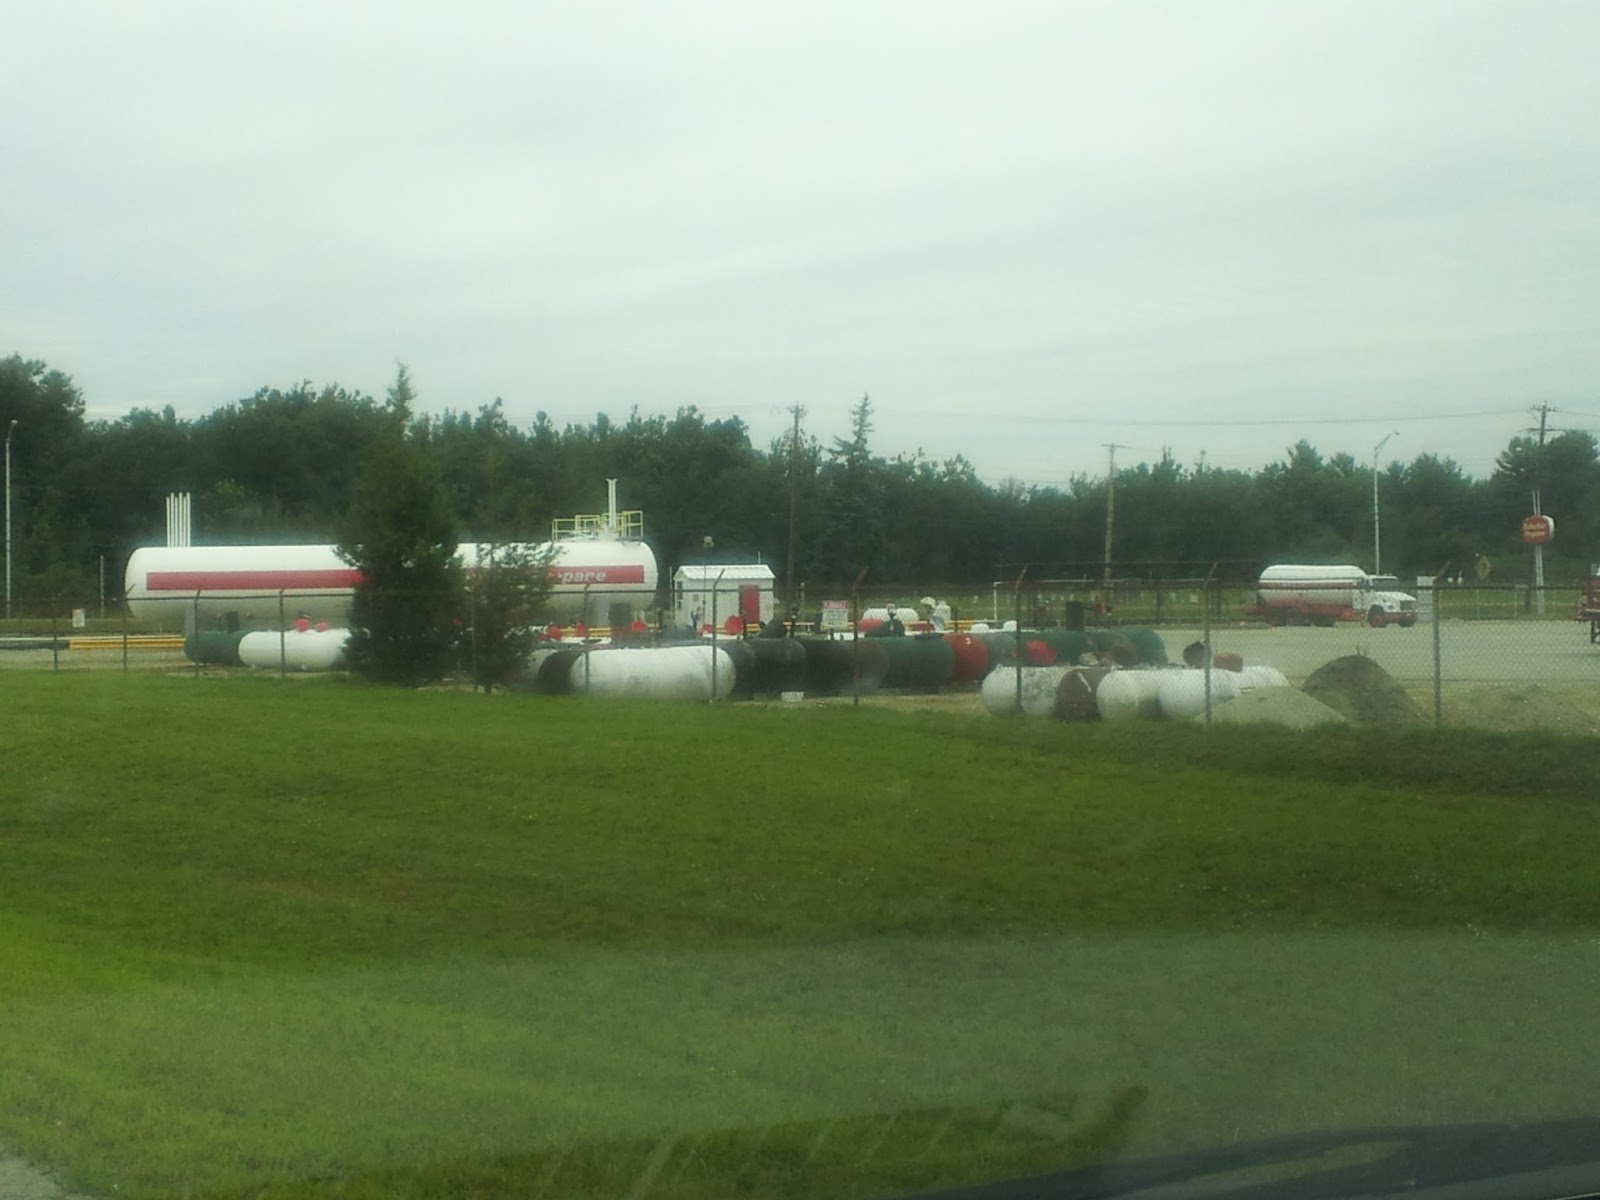
To make its way to New Hampshire, our propane molecule is then pumped across country in the Texas Eastern Transmission pipeline, known as TET, to distribution points in New York State. From there it is distributed to New England retailers in rail tanker cars or propane tanker trucks. Propane is then stored onsite at various propane retailers (see photo below) and from there it is transported by a smaller propane truck to be pumped into storage tanks at residences. Propane also makes its way into New England from East Coast petroleum refineries, natural gas operations in Pennsylvania, imports from Canada and, occasionally, waterborne imports from East and Gulf coast locations, or even Europe.


An illustrative diagram from the EIA, showing the flow of propane from well head to a home, is presented below.


There are two large propane storage terminals in New England. Both are located on the coast - one is in Providence, RI, and the other is in Newington, NH. Both are used to receive large shipments of waterborne propane but it is my understanding that these shipments are far and few in between at the moment as a result of low propane prices and the economics of waterborne propane shipments. In April this year, a plan to install a 22 million gallon propane storage facility in Searsport, Maine, was shelved due to local opposition and changing economic conditions in the propane business. The original intent of the project was to bolster propane storage for the State of Maine which was faced with a severe propane shortfall in the winter of 2007.

Let us now turn our attention to the matter of propane pricing. Presently propane is selling for $2.99/gallon for bulk residential delivery in NH but its price at the Mont Belvieu hub is $0.85/gallon. (Just last week, I filled my 5 gallon propane tank for my gas grill and it cost me $4/gallon.) I find these spreads between the commodity and retail prices very interesting, especially as we have to bear them. I want to understand how a product that costs less than $1/gallon in purified form at the main hub ends up costing us $4/gallon or higher. I find it useful to compare fossil fuel price spreads to those between crude oil and gasoline at the pump. Crude oil last week was about $106 per barrel (Brent pricing) and at 42 gallons per barrel, this calculates out to $2.53 per gallon of crude. Compare this to refined gasoline prices at the pump at $3.53 per gallon, which gives us a $1/gallon spread to cover refining, transportation, storage, taxes, marketing and a profit margin. Now I know this comparison of crude oil to refined gasoline at the pump is, at best, an approximation - as 1 gallon of crude does not necessarily lead to one gallon of gasoline but, for our purposes, it will suffice. The table below provides some spreads for hydrocarbon fuels and, even though these spreads are not exactly comparable, they provide a useful basis of comparison for the propane spread.

I have highlighted the propane ratio - which is on the low end at the moment. There are times, particularly in the high usage winter months, that this ratio will climb to 4.5 or as high as 5.
 
What are the reasons for these high spreads in propane prices? Why should propane cost more than 3.5 to 4.5 times its wholesale price at the hub - especially at a time when we are swimming in excess propane in the USA? In fact, we now have so much propane in the US as a result of the natural gas boom, that we are exporting large amounts of propane from the US.

It proved challenging to find someone in the NH propane industry to chat to me about these price issues. In every case, my calls to various propane dealers and even to the New England Propane Association went unanswered. I suppose one could generously assume that these folks were busy and simply did not have time to share with me the complexity of the propane business. Without an insider's understanding of the business, one is left with publically available information so here is what I know: 
 

  • The propane industry is an unregulated industry and, as such, does not come under the purvey of the Public Utilities Commission.
  • There are a large number of propane distributors in New Hampshire, ranging from small operations to larger ones.
  • The Consumer Protection and Antitrust Bureau of the NH Attorney General's office receives approximately 30 propane-related complaints per year.
  • The propane business is highly seasonal, with sales peaking in the winter months -see the figure below.
 
     
  • Propane dealers have to hold inventories of propane through the slow summer months and they have to bear the carrying costs associated with their propane inventories throughout the year.
  • There are various different types of retail propane contracts out there. Some dealers will lease a storage tank to a customer. However, should a customer want to change suppliers, they have to pay significant costs to have the leased tank emptied and removed. These high changeover costs can essentially "lock in" a customer, making it difficult to change propane suppliers. A better solution would seem to be to own one's own tank but this requires a big upfront investment and some propane dealers only service their own tanks. It would seem that propane users would be beholden to a regional group of propane dealers and some propane users have complained of being held "captive" by their propane dealers.
  • Generally, there is little transparency in the propane market as it is not a regulated commodity like natural gas or electricity. As such, residential propane users are subject to the whims and fluctuations in their regional distribution markets which may make getting competitive prices challenging.
  • Propane prices fluctuate considerably from dealer to dealer and direct comparisons are sometimes difficult. Sometimes quoted prices are "all-in" delivery prices and sometimes they exclude delivery charges and other miscellaneous charges that get tacked on, such as hazardous material handling fees. According to the folks at the NH Office of Energy Planning, OEP, the spread of propane prices can sometime vary as much as a $1/gallon across the State.

As I worked to understand more about the propane industry, local pricing started to perplex me, especially when I compared it to national pricing averages. Consider the following facts:
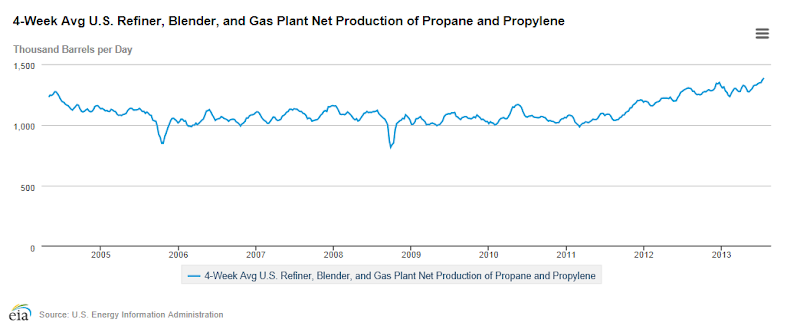
  • Propane production has increased in the past few years due to the natural gas boom – see the chart below.
  • Due to the surfeit of propane, prices are down. In fact, propane prices used to be tightly coupled to those of crude oil. For many years, the commodity price of propane, the Mont Belvieu hub price, would run at between 60 and 70% of that of crude oil. Now the relationship has broken down and propane commodity prices are averaging about 40% of crude oil prices. This is reflected in lower propane commodity prices during the past two years as shown in the figure below. Since the peak in June 2008, propane prices are now 54% lower. In fact, commodity propane prices are close to what they were in 2004.

And what of retail propane prices in NH? Retail propane prices are collected by a survey conducted by the NH OEP and are passed along to the Energy Information Agency, EIA, where the data are made available for access. However, pricing data are only collected during the heating season, from October to March, which is the reason for the annual gaps in the NH retail propane price data I have presented in the chart below.

As can be seen, we in NH seem to have been subjected to a steady increase in the price of propane since 2004 and prices this past heating season were 226%(!) higher than those in 2004. It is interesting - and puzzling at the same time - to try to understand why long-term retail propane pricing has not reflected longer term changes in the underlying commodity prices. As I have noted earlier in this blog, the residential propane business is a very seasonal one and the challenge for propane dealers is that the bulk of retail propane sales are made in the winter months. However, they seem to be able to compensate for this by generally pushing prices higher during each heating season.

Even though I write from a NH perspective, the reader should appreciate that NH is not being singled out regarding residential propane prices: similar variations in residential propane prices have been observed throughout the US. But, here in NH propane consumers feel them more acutely as NH residential propane prices are, on average, 19% higher than the national average. That 19% average is perhaps reflective of the fact that we are pretty far down the propane distribution chain and it takes a lot to get that propane from Mont Belvieu, Texas, all the way to NH. It should be noted that I determined the 19% figure by averaging the retail prices for the individual heating seasons for the US and for NH and then calculated the ratio of the NH average heating season retail prices to those of the overall US numbers. In the figure below you can see the results of these calculations. The premium of NH propane prices to those of the US average fluctuates from year to year around the 1.19 average line but it is rather notable that the premium associated with NH retail propane this past 2012/2013 heating season is way above the average and NH propane cost 30% more than the US average. This clearly shows that NH propane consumers are not benefitting from lower commodity prices. While the US is now awash in propane and is exporting it, propane users in NH would seem to be subject to the whims of an unregulated propane market.

There is clearly much I do not fully understand about pricing issues in the retail propane market but, when compared to other fossil fuel sources, it is certainly lacking in transparency. The retail propane market is like crossing muddy waters* - one looks down and wonders what lies below the surface. Perhaps the readers of this blog might know more.

Regardless, the data clearly indicate that propane premiums in NH are presently excessive, compared to historical averages, and it will be interesting to see if they come back into line during the next heating season. For propane consumers in NH, it could be an expensive experiment.

Until next time, fill up your propane tank to the brim during the summer and remember to turn the lights off when you leave the room.

Mike Mooiman
Franklin Pierce University

mooimanm@franklinpierce.edu
8/16/13


(Crossing Muddy Waters* - A John Hiatt tune from a 2000 album with the same name. John Hiatt has always been one of my favorite singer songwriters and has been covered by dozens of artists including Bonnie Raitt, Bob Dylan, Keith Urban, Iggy Pop, etc. etc. He is worth discovering if you don't know his music. Enjoy Crossing Muddy Waters.)

Click on this link to receive email notifications for Energy in New Hampshire updates


Monday, July 15, 2013

Under Pressure* - Propane in New Hampshire – Part 1

As I drive through New Hampshire, I have seen a good number of the distinctive white propane storage cylinders dotting the landscape next to homes and commercial buildings, in backyards or sometimes rusting in fields. I got the sense, which I later confirmed, that propane usage in NH is higher than other New England states and I decided to do some research on this fuel source and its usage.


Natural gas, which consists largely of methane, and propane are similar in some respects. They are both hydrocarbon gases and they are both odorless and colorless. The distinctive smell of propane and natural gas that we know is due to the odorant distributors are required to add to the gas for safety reasons. The odorant is normally a smelly sulfide compound, like ethanethiol in the case of propane.

Methane consists of a single carbon and four hydrogen atoms and propane has three carbons and 8 hydrogen atoms. The chemical structures of the various hydrocarbon gases one might find in natural gas and store-bought propane are shown below.


Both gases can be compressed for storage purposes but a particularly attractive feature of propane is that it can be readily converted to a liquid form by compressing the gas at moderate pressures. It is this easy conversion of propane gas into liquid form, enabling useful amounts to be stored on-site in steel storage tanks of various sizes, that makes it a versatile fuel. At 80oF the pressure in a propane storage tank is about 150 pounds per square inch (psi) which is not much higher than the pressures in my road bike tires which I typically inflate to 110 psi with a bicycle pump. Natural gas can also be liquefied, but very low temperatures and higher pressures are involved.

Most of us are familiar with propane in its liquefied form in those 5 gallon propane tanks that many of us have attached to our backyard barbeques (unless you are a charcoal purist - which I used to be). Once condensed into a liquid, propane weighs quite a bit. In fact, a full 5 gallon tank of propane can contain almost 20 lbs of propane - which is why those little cylinders are so heavy once they are filled. The weight of the 5 gallon empty tank is about 20 lbs so a full tank weighs about 40 lbs. Liquid propane is readily converted back into a gaseous form simply by turning open the valve on the tanks and releasing the pressure.
 
Propane, like methane, is a clean-burning hydrocarbon gas with fewer harmful combustion products than oil or coal. The main emission products are carbon dioxide and water, but on a per energy unit basis, propane does release ~20% more carbon dioxide than natural gas. Out of all the carbon-based fuels, methane has the lowest amount of carbon released, per unit of energy released, which is the reason that carbon emissions in the US have dropped as we have moved from coal-fired to natural gas-fired electricity generation. The table below shows the carbon dioxide emissions per million BTUs produced by the combustion of different fossil fuels.


Other than backyard barbequing, propane has a host of other uses including petrochemical production, home heating and cooking, a fuel for industrial forklifts and extensive use in powering farm-based irrigation and refrigeration systems. It also has a growing importance, due to its portability and easy storage, as a back-up fuel for renewable energy systems such as solar power.
 
Some of the attractive features of propane include the following:
  • High energy density once liquefied and available in many different storage sizes.
  • Highly portable fuel.
  • Bulk transportation by pipeline, rail car or tanker truck.
  • Useful alternative to natural gas where natural gas pipelines are not available. It is often the fuel of choice in remote areas.
  • Versatile home-based fuel that can be used for heating, hot water and cooking applications.
  • Easy onsite storage and, if leaks occur, they do not contaminate the ground like oil.

To get an understanding of the propane business, it is helpful to know where propane comes from. Propane is a byproduct of the natural gas and oil business and it is not produced for its own sake. The byproduct nature of propane means that propane supply, and thus pricing, are highly dependent on oil refining output and natural gas supply. When natural gas is recovered from conventional or shale gas deposits, it is often accompanied by other hydrocarbon gases, such as ethane, propane, propylene and butanes. Natural gas that contains a lot of these other hydrocarbons is referred to as "wet" gas. These other gases are removed during the processing of natural gas, which serves to remove water, sulfur and other byproducts as well. The hydrocarbon gases are also separated into separate fractions - ethane, propane, butane, etc., - each of which has its own specific use. Propane is also a byproduct of the crude oil refining process, during which longer chain hydrocarbon molecules are cracked into shorter chain molecules such as propane, butane, pentane, etc.

Propane was first harvested and liquefied as a useful byproduct of oil refining which is why it is also sometimes called Liquid Petroleum Gas, or LPG. Because the propane we get is a byproduct of various gas separation processes, it does contain other components. The consumer grade we purchase is known as HD-5 (Heavy Duty – no more than 5% propylene) and it is required to contain over 90% propane, a maximum of 5% propylene and 5% ethane and butanes. It can also contain trace amounts of water and sulfur.
 
As with other energy forms, propane usage in New Hampshire has increased over time. Recent data indicate that over the 1960 to 2011 period, usage has increased 3.8% on a compounded annual basis, outstripping total NH energy use which grew by 2.4% over the same period. Even though growth in propane usage has been greater than that of general energy consumption, propane is a very small percentage of our total New Hampshire energy use: in 2011 it represented only 3.6% of the total consumption of energy in NH. So, in the larger scheme of things, some might view propane as unimportant, but for folks out in remote areas, without access to natural gas, it is very critical. The consumption figures for 2011 were 3.7 million barrels of propane, which is equivalent to 152 billion gallons (at 42 gallon/barrel) or 13.9 trillion BTU. The figure below shows the growth in NH propane consumption since 1960.


The following chart shows the 2011 annual consumption of propane in the New England States and it shows that my original hunch, that propane usage in NH was high, was correct.


However, if the numbers are adjusted to a per capita basis as I have done in the table below, it is Vermont and then New Hampshire that lead the pack on a per person basis. The state that uses the most propane overall is Texas, which is responsible for 60% of the US propane consumption. The reason for this high consumption is the large petrochemical industry in Texas and the bulk of propane consumption in Texas is for the production of petrochemicals used to produce plastics and other organic compounds.

Propane is a useful fuel but one of the biggest concerns associated with propane is its cost. In the table below, I show a listing of the costs of the various home energy sources we use in NH along with their recent energy prices. This is an update of one previously published in Closer to Home. Included in the table are the energy content per BTU/unit, the cost in $ per million BTU ($/MMBTU) and then, using energy conversion efficiency concepts for each fuel, I have calculated the cost of the useful energy produced from each type of energy, assuming the energy source is used for heating only.


It is easier to examine this information in graphical form and, to this end, I have generated the chart below which allows us to directly compare the costs of the input and useful heating output values for each of these fuel sources on a common basis, $ per million BTU. The chart tells us a lot but if we focus on propane which is right at the top of the chart, it is clear that at this time, propane is the most expensive fuel in the State on energy output basis. Presently, natural gas is by far the cheapest energy source in NH.


Like other energy sources, propane prices have risen over time as shown in the figure below and, for the most part, propane prices have moved in lock step with oil prices. The figure also clearly shows the decrease in natural gas prices since the large-scale advent of fracking technology in 2008 which is used to harvest natural gas from shale deposits. The tight relationship between propane and oil prices is somewhat explained by the fact that propane is a byproduct of oil production but propane is also a byproduct of natural gas drilling and there is presently a surfeit of propane due to all the natural gas we are harvesting. What's more, there is now so much propane being produced that we are now exporting propane from the US. New Englanders do not appear to have benefitted much from the increased supply of propane: that will be the topic of Part 2 of this blog where I will be looking at the supply, demand and pricing issues pertinent to propane usage in New England.


Many of us use propane at some time or another so a few safety comments about propane are appropriate. In terms of home usage, whether using a gas grill or for home heating, it is important to understand that propane is a highly combustible gas under pressure* and it is crucial to make sure that all the gas line fittings are tightly fastened and that there are no leaks. You can easily check for leaks using a soapy water solution and for those of you using propane for home heating and cooking, I would strongly recommend the installation of a combustible gas monitor in your home which can detect dangerous levels of methane and propane. If there is a propane leak you might be able to smell it, but sometimes, because propane is heavier than air, it can accumulate to dangerous levels in basements and trenches in or around your home where you might not be able to smell it. My advice is to back up your nose with technology. A home combustible gas detector unit only costs about $50 and is a wise investment. It will also work if you have natural gas in your home.

To wrap up this week's post, I thought I would cover a topic that is of great interest to all us home grillers. One of the great mysteries of gas grilling is how to determine how much propane is left in the propane cylinder and whether you will run out before all the hamburgers are grilled. Now, if you are like me, you have run out of propane when grilling on a Sunday evening when no refilling stations are open and you have had to endure dirty looks from your significant other and beer-fueled jibes from friends. Well, those days are over - there is an easy way to determine how much propane you have left. Simply weigh the cylinder on a regular bathroom scale and subtract the tare weight which you can find stamped on the top ring of the cylinder. The pictures below are of my propane cylinder just a few days ago. As you can see the weight of the cylinder is 28.5 lbs and the tare weight is 18lbs so my tank contained 10.5 lbs of propane – it was about half full.


The next thing to figure out is how much propane a grill will consume. Typically a home barbeque with all the burners running has a rating of about 40,000 BTU/hr. The BTU content of propane is 91,333 BTU/gal and, at 4.23 lbs propane per gallon, this is equivalent to 21,550 BTU/lb. This means that you should be able to grill for about 1 hour for every 2 lbs of propane you have in the propane tank. So, based on the photos above, I have enough in my tank to grill for about five hours. By the way, those pressure gauges that you can buy for propane tanks are pretty useless. Because propane is a liquefied gas, the vapor pressure is constant as long as there is propane in the tank. The pressure will only begin to drop when there is no longer any liquid in the tank and by then it might be too late and you are likely to run out of propane while grilling.

Until next time, don't run out of propane and remember to turn the lights off when you leave the room.

Mike Mooiman
Franklin Pierce University

mooimanm@franklinpierce.edu
7/14/13


(*Under Pressure – A big 1980s hit for Queen and David Bowie who put this song together while improvising in a recording studio in Montreux, Switzerland. It retains some of its improvisational roots in its "Um, boom, ba, bay.." type lyrics and its distinctive bass riff is something every bass player fools around with one time or another. It is easy to find this song on Youtube but here is an interesting version featuring Annie Lennox and David Bowie practicing for the Freddie Mercury tribute concert. David Bowie could not be more relaxed, singing and smoking at the same time.)


Sunday, July 7, 2013

Sixteen Tons* - Tough Times Ahead for Coal-Fired Electricity in New Hampshire


Prior to the commissioning of the Seabrook nuclear power plant in 1990, a large portion of the electricity generated in New Hampshire came from the combustion of coal. Since then, as shown by the data in the figure below, the importance of coal-fired electricity has diminished substantially. Last year coal was only responsible for 7% of the electricity generated in the State. In this post, we take a look at the coal-fired electricity business in New Hampshire and some of the challenges it faces.
 

To understand the coal-fired electricity business, we should start with the fuel – coal. Coal is the most abundant fossil fuel on the planet and it consists largely of carbon plus varying amounts of hydrogen, oxygen, nitrogen and sulfur. Coal used for electricity generation normally has a carbon content greater than 75% and it also contains compounds of aluminum,calcium and silicon that form coal ash when coal is combusted. On top on those elements, coal is also contaminated with deleterious metals, such as cadmium, mercury, selenium and lead. The key problem associated with coal is that, on burning, it releases these nasty elements and they end up in the off-gases, from which they have to be removed in expensive particulate capture and gas scrubbing units. In spite of these air cleaning units, considerable quantities of these metals are released into the atmosphere.

In a coal-fired power plant, the coal is pulverized and fed into a burner which heats a boiler that produces steam. The steam, in turn, drives a turbine which turns the generator to produce electricity. The main inputs to a coal-fired power plant are coal, water and labor; the outputs, other than electricity, are numerous and problematic. First of all, there are all the nasty contaminants such as sulfur and the deleterious metals that need to be removed from the off-gases in large water-based scrubbing units. These metals are recovered from the scrubbing solutions and then need to be disposed off as hazardous waste. A basic flowsheet for the coal-fired electricity business with the main inputs and outputs are shown in the figure below.


Generating electricity from coal is highly inefficient so there is a great deal of waste heat that is created. As I noted in Not So Classical Gas, the conversion efficiency for NH coal-fired power plants is only 31%. In other words, only 31% of the energy in the coal is converted into electricity and the other 69% is lost as waste heat. A great deal of this waste heat is transferred to the cooling water that is critical for the operation of these power plants. This cooling water either comes from natural waters in rivers and lakes or from the large evaporative cooling towers such as the ones shown in the figure below which are typical of power plants located away from large natural water supplies. The problem with using natural water supplies is that large volumes of water are needed to absorb the waste heat. In the process, the water is filtered, treated and is warmed up. This, of course, negatively impacts any fish and other aquatic creatures that might be sucked into the cooling water intakes. On the discharge side, the receiving water body might have a limited capacity to absorb the waste heat and this can impact the natural water ecosystem, affecting both plant and aquatic life forms.


Coal ash is another byproduct of coal combustion. This largely consists of a fine, non- combustible silica and calcium oxide residue and it often contains appreciable amounts of deleterious elements like mercury, cadmium, chromium and others. The ash is stored on-site at power plants or is disposed of in landfills. In some cases it can even be used as a component of Portland cement.
 
It is all these nasty byproducts - hazardous waste produced from the scrubber solutions, coal ash and a great deal of waste heat – that are behind the assertion that coal is a dirty fuel. And this does not even begin to consider the issues associated with coal mining - which is a difficult, complex and hazardous operation that has significant environmental impacts. Coal's only redeeming factors are that the US has large coal reserves and, until recently, on an energy equivalent basis, it was less expensive than natural gas.

New Hampshire has two large coal-burning plants both owned by Public Services of New Hampshire (PSNH): the large 440 MW facility located on the Merrimack River in Bow and the smaller Schiller plant located on the Piscataqua River in Portsmouth. Some technical details for these operations are provided in the table below.


Due to lower costs of wholesale electricity, driven by low natural gas prices, both of these operations have been challenged the past few years to provide electricity at prevailing market rates. As a result, the outputs from these operations have dropped off considerably and in 2012 the Merrimack plant only operated at 31% of its theoretical capacity and the older Schiller Station only ran at 9% of its theoretical capacity. However, as the chart below shows, in the first quarter of 2013, with the brief period of natural gas pipeline limitations that we encountered in New England, these operations, and particularly the Merrimack Station, were again able to operate at higher rates. In the first quarter the capacity factors of the Merrimack and Schiller operations were 0.83 and 0.32, respectively, which are higher than the 2012 numbers presented in the table above. Unfortunately, this improvement is most likely a short-term event. Recent monthly data from the EIA show that, in the second quarter, these plants are barely operating again. Other than in the unlikely advent of high natural gas prices, it appears to be another tough year ahead for these coal-fired operations.


On top of the market price challenges, the Merrimack plant has had to deal with new operating permits for discharge of wastewater from their operations, which limits water-borne metal discharges as well as waste heat. The latter limitation could even result in the installation of those large expensive cooling towers shown in the photo above. At this time I believe the wastewater discharge permit, which took the EPA 14 years (!) to draft, is still in dispute.
 
To compound PSNH's coal-fired electricity challenges, the NH Public Utilities Commission (PUC) recently released a report which discussed the challenges associated with PSNH's high cost of electricity, its dwindling customer base in a competitive environment, the challenges of recovering costs of past investments from a smaller group of customers and even the divestiture of PSNH electricity-generating operations, including their coal-fired power plants. If PSNH were to divest themselves of their generating assets, this would complete the process of deregulation, leaving PSNH just in the distribution business. But to do so would require the State to come to terms with how to compensate PSNH for past investments and fixed costs that they have not recovered through the sales of electricity. This is indeed a difficult and contentious issue and will require a lot of study. This would have all been easier years ago, before the advent of cheap natural gas, when coal plants still had value and stranded costs could have been recovered by higher prices for generating units. Now there is even some speculation that PSNH NH coal-fired power plants have no value at all.
 
So NH coal operations are being squeezed every which way. They have to deal with cheap natural gas, tougher air and water discharge restrictions, customer loss due to competitive landscape, and then - just two weeks ago - President Obama mentioned in a recent speech that he has directed the EPA to prepare to limit carbon dioxide emissions from new and existing coal-fired power plants. This is not good news for coal-fired energy in NH and perhaps it is time for PSNH to consider converting these their coal-fired operations to natural gas operations, which is what some utilities in other parts of the country are doing. Something has to be done otherwise we and PSNH are going to be singing that that famous line from the Tennessee Ernie Ford coal mining song, Sixteen Tons*, "Sixteen tons and what do you get - another day older and deeper in debt."
 
Quite frankly, it is all a bit of a mess. Because of foot dragging, extended negotiations during restructuring deliberations and legal actions by various parties, PSNH has perhaps held onto to its generating assets long after they should have been sold. With the recent advent of cheap natural gas, those coal-fired assets are now worth substantially less and, because legislation allows for cost recovery in the case of divestiture, modification or retirement of assets, NH residents are going to be on the hook one way or another for investments made by PSNH to maintain their coal-burning attributes.

Such are the joys and responsibilities of a public utility. On one hand, we want them to provide cheap and reliable electricity, we want them to be there as a backstop to other providers, we want them to invest in infrastructure build out and investors and lenders, who foot the bills for the infrastructure projects, quite correctly expect a financial return. Oh yes, and then we want them heavily regulated in a competitive environment as well. All of that comes at a price. The verdict on the wisdom of restructuring is, in my mind, still out. Yes, there is cheap electricity available and many folks are benefiting from lower rates, but we are still are going to have to foot the bills for past public utility investments, one way or another. If the message goes out that lenders and investors have to bear the brunt of the write-offs, this will send a chilling message to this group and future large-scale infrastructure investments, which we very much need, will become difficult to fund. There are tough days ahead as we work through the consequences of the restructuring programs underway.
 
There is perhaps some gloating over the way PSNH is being squeezed from all sides but it is important to note that natural gas is not necessarily an all-around better option. Yes, it is a cleaner fuel with far lower deleterious contaminant levels, but the means of recovery from shale via fracking has a host of associated issues including wastewater treatment, methane losses and seismic disturbances. A recent study showed that the greenhouse effect impact from fugitive methane emissions associated with shale gas is rather shocking. The article, published in the journal Climate Change, analyzed the methane emissions connected with shale gas exploitation and the authors compared the effect of higher methane emissions associated with fracking for natural gas with conventional gas wells. Even though methane combustion releases less carbon dioxide than coal burning, the increased methane emissions from shale gas extraction, coupled with the fact that the greenhouse effect of methane is 25x that of carbon dioxide, means that, in the short term (20 years), the greenhouse gas impact of shale gas is considerably higher than that of coal. However, over a 100-year period, shale gas is equivalent to that of coal because methane has a shorter atmospheric lifetime than carbon dioxide. This study suggests that transitioning from coal to natural gas produced from shale gas will do little in the short term for global warming trends. Now that is pause for thought.

So where do we stand at the moment? A week ago PSNH published a lengthy but well reasoned response to the PUC report and it is clear that there is much to be taken into account in the debate regarding the fate of PSNH's generating assets. The New Hampshire legislature has recently passed legislation SB 191 which requires NH to establish a ten year state energy strategy plan. We have a lot to think about and deal with in the next year or so and it is now time to set up conferences, roundtables and meetings so we can come up with a well-researched and thoughtful plan for the future. Remember: it is not just about us. It is about future generations as well and they expect us to make wise decisions. Let's make the best of this opportunity and not leave them with a battered can that we have just kicked down the road.

Until next time, remember to turn off the lights when you leave the room.
 
Mike Mooiman
Franklin Pierce University
mooimanm@franklinpierce.edu
7/5/13


(*Sixteen Tons – A song written by Merle Travis and made popular in the 1950s by Tennessee Ernie Ford. Johnny Cash did a great cover but here it is featuring one of my favorite guitar slingers Jeff Beck playing with Billy Gibbons of ZZ Top. Enjoy Sixteen Tons)

Click on this link to receive email notifications for Energy in New Hampshire updates


Tuesday, June 18, 2013

Against the Wind* – Making Money in the Wind Business in New Hampshire – Part 2


Somebody's Backyard - Coal Fired Power Plant and Wind Turbines

Following up on my post Blow Wind Blow, where we took a look at the revenue side of the wind business, this week we take a look at the cost aspects of running a wind farm. One pleasing aspect of the wind business is that there are a lot of organizations promoting wind energy and, as a result, there is a lot of information available about wind and the costs associated with wind projects. The challenge is shifting through this information and pulling out the data relevant to New Hampshire wind projects. I have found the information from the American Wind Energy Association, AWEA, and particularly that from the National Renewable Energy Laboratory, NREL, to be particularly useful.
 
Another challenge associated with working through the wind cost data is that wind project financing is a complicated business. There is equity and debt financing, there are investors who contribute simply to access the tax credits and there are funding and repayment mechanisms that change part way through the life of the project. All of these different mechanisms are used raise funds from different groups of investors and to accelerate returns to the original core group of investors. Wind project financing gets rather involved and it can change considerably on a project-to-project basis, making comparisons difficult. To simplify our analysis, I have found the best basis of comparison, across different wind projects and renewable energy technologies, is to determine the levelized cost of energy, LCOE.

The LCOE is a way of calculating the aggregate costs for an energy project and takes into account the overall capital investment in the project as well as the annual operating and maintenance costs over the life of the project. Using the time value of money, all future costs are discounted, using a minimum desired return, to the present and are then divided by the discounted total of energy produced from the project to provide a single number that is indicative of the all-in cost of electricity from the project. Normally on any energy project, the LCOE is the first calculation performed as it is relatively easy to do. As the project development progresses, the calculations become more involved and sophisticated as different funding mechanisms are considered. Sometimes LCOE calculations include taxes and incentives but I have taken those into account in my revenue calculations in my last post so I have not included them in my calculations. I refer you to this NREL source should you want to learn more about calculating LCOE.
 
Wind projects take a long time to get off the ground. There are years of wind monitoring for a selected site, environmental impact studies, navigating local property tax payments and overcoming local opposition and legal hurdles. In addition, power purchase agreements and transmission line access have to be negotiated. This can sometimes take three to four years and a great deal of investment before ground is broken on a project. Even with years of upfront work, success in not guaranteed, as the NH Site Evaluation Committee recent rejection of the Antrim, NH, wind project has demonstrated.
 
Once all the approvals are obtained then the major expenditures in site preparation, road construction, foundations, turbines, turbine installation and transmissions lines are incurred. The wind business is a capital-intensive business and the installed costs of new wind turbines range from $2 million to $2.5 million per megawatt. Based on published investment costs for the NH wind projects, the costs in NH are of the order of $2.5 million/MW (see table below), most likely due to the local permitting challenges and installing the turbines high up on ridge lines. As a comparison, establishing a gas-fired combined cycle plant costs about $800,000 per megawatt – one third of the cost of a wind energy operation.
 
The other important costs are the annual operating and maintenance costs associated with wind operations. Unlike the gas-fired power plants, the good thing about wind projects is that there no fuel costs. Operating costs for wind energy operations include fixed annual costs, like land lease costs, state and local property tax assessments, maintenance contracts, the operating staffing associated with the wind farm as well as other general administrative costs like insurance. Variable costs include the costs of electricity to power the operation as well as unanticipated maintenance costs which tend to increase over the life time of the operation. Exact costs for all costs components vary from project to project and tend not to be available for specific projects. As a result, one has to rely on published data and industry averages. The table below provides the capital investment, land lease and property tax costs and estimates associated with the various NH wind operations that I have been able to assemble from various publications. The table also shows the calculation of these costs on a per megawatt basis. Overall, the installed capital costs for these projects have been of the order of $2.5 million/MW and the weighted average of the fixed land lease and property tax portion costs are $27,000/MW ($27/kW) per year.


The figure below shows the various costs components as well as my estimates of these for the NH wind projects. The cost data reflect averages and my estimates rather than specific costs associated with any particular project. These costs were then used to calculate the LCOE for a typical NH wind operation - which I estimate to be $126/MWh ($0.126/kWh). The operating costs, fixed and variable, when converted to the cost of MW of electricity produced, are of the order of $20/MWh. The annualized capital costs are $106/MWh, demonstrating that the majority of the cost, 84%, of producing electricity from a wind farm is related to the large upfront capital investment.


I will note that my calculated costs are higher than the $71/MWh national average calculated by NREL. The difference is due to the following:
  • The capacity factors for NE wind projects – typically 0.30 – are lower than the national average of 0.38;
  • The capital costs of $2.5 million per MW I have used are higher than the $2.1 million figure used by NREL;
  • The non-capital related operating costs used by NREL are $10/MWh which are lower than my estimate of $20/MWh.

In the figure below I have incorporated my revenue diagram from my last post with the cost diagram above to provide a comparison of the revenue and cost structure on a single figure so you can get a sense of the margins in the wind business. It is important to bear in mind that revenues and costs vary over time and are different for each specific project. Many of the costs are fixed but the revenue that wind farms can obtain from electricity and REC sales can be highly variable and dependant on customer demand and negotiated power purchase agreements. Overall profitability, of course, is also very much dependent on how hard and how often the wind blows.


One might argue about some of the specific details associated with my cost estimates but they do reflect the fact that operating wind farms in NH is rather different to an equivalent (and often much larger) operation on the great plains of Nebraska. It is my assessment that the costs of NH wind electricity are high: the importance of subsidies from the production tax credits and the sales of RECs are therefore very important to the wind industry. The subsidy portion of the revenue stream is 50% or more of the overall revenue. Without these subsidies these wind farms would be under pressure to make money and they would definitely find themselves struggling to make headway against the wind* in a high cost and low subsidy environment.

Until next time, remember to turn off the lights when you leave the room.

Mike Mooiman
Franklin Pierce University

mooimanm@franklinpierce.edu
6/18/13


(*Against the Wind – A 1980 album and tune by Bob Seger. An oldie but goodie suggested by blog reader Laurie Smith from South Africa. Bob Seger had a thing for mid-tempo ballads telling stories of struggle and sometimes redemption. Here is the link – Against the Wind)

 
Click on this link to receive email notifications for Energy in New Hampshire updates

Monday, June 10, 2013

Blow Wind Blow* – Making Money in the Wind Business in New Hampshire – Part 1


Overhead View of Lempster Wind Farm Taken by Author

In my post Windfall, I briefly discussed some of the business aspects of New Hampshire wind farms and some of the challenges they might face. There is a lot more to the wind business here in New England, and I thought it would be interesting to take a deeper look at some of the revenue and cost considerations these operations face over my next two posts. This week we take a close look at some of the revenue aspects of these wind operations.

Let's start with the recent performance data from FERC for these wind farms. The table below shows the summarized first quarter of 2013 results for the three operating wind farms in New Hampshire, the two Iberdrola operations – Lempster and Groton – and the large Granite Reliable operation located near Dixville.


 It is clear that they did well in the first quarter. A few points of note:

  • The Lempster operation output was remarkably high, particularly for the month of January, and they are showing capacity factors for the quarter of 0.42 which is surprisingly large. The average price they received for their electricity was $77.17 and, at times, it was as high as $102.99 /MWh. Clearly they have an attractive power purchase agreement with PSNH.
  • After a miserable year last year, the Granite Reliable operation did much better with a first quarter capacity factor at 0.29 which is up from last year's value of 0.15. The bulk, 83%, of their sales went to the two Vermont utilities at rates averaging $96.57/MWh. However, there were times they were selling into the ISO-NE electricity pool at rates as low as $0.66/MWh.
  • The Groton Wind operation is now up and running and all their sales went to NSTAR Electric at $51.65. Their overall capacity factor for the first quarter was 0.25.
     
In my last post, I pointed out the poor performance of the Granite Reliable operation, which only had a capacity factor of 0.15 for 2012, and which was half of the expected value of 0.30. During the week, a number of knowledgeable readers pointed out to me that the reason for the low output and capacity factor for the Granite Reliable operation in 2012 was that ISO-NE had put in place curtailment orders for several New England wind farms. This meant that they were required to reduce the amount of electricity they were delivering into the grid even if they could produce more. The curtailment orders included the Granite Reliable operation, which had to ratchet down its output to about 50% of its rated capacity of 99 MW. The reasons behind the curtailment orders appear to be reduced demand for electricity as well as grid load imbalances in certain areas. Wind-based electricity is a challenge for the electrical grid operator, ISO-NE, as electricity production from these operations is highly variable and, with the growing number of wind operations, the variability of electricity supply has increased. At the same time, the grid operator has to manage the output from fossil fuel and nuclear power plants that supply a great deal of our base load power and that cannot rapidly be turned up or down in response to varying output from wind farms. Curtailment orders for these wind farms is one way to manage the variability but that does leave the owners of these operations with unused capacity and lost revenue opportunities.

Wind farms get revenue from a number of sources. The first is from the sales of electricity, which could be via a power purchase agreement (PPA), such as the one the Groton operation has with NSTAR, that sets a fixed price for the price of generated electricity, or if could be by direct sales into the ISO-NE electricity pool where prices are set by supply of and demand for electricity. Prices for electricity sold into the ISO-NE pool can be highly variable over time as I noted in It Don't Come Easy and there are considerable price swings, even over a day, as shown by the chart below which provides 5 minute electricity prices for last Thursday, June 2, 2013. In the first quarter of 2013, the three NH wind farms earned almost $9.2 million dollars on total electricity sales of 112,084 MWh to earn an average of $82/MWh.


If you are an energy geek like me, you might be interested in tracking prevailing energy prices on the ISO-NE grid. To use a popular phrase in these smart phone days "There's an app for that!" You can download the ISO-NE ISO to Go app at this link. The app shows you local prices for electricity as well as how demand is tracking forecast and the fuels being used in the present generating mix. This morning at 6.45 am as I am writing this blog, the costs of electricity are only $24.68 per MWh. Yesterday at 3 pm when I checked, it was $45.37 per MWh. Typical screen shots you will see on this app are shown below.


The other source of revenue for wind farms is from sales of Renewable Energy Credits (RECs) – the so-called green tags which I discussed in It Don't Come Easy - which allow generators of renewable energy to sell the renewable energy attributes separately from the underlying electricity. The pricing for Class 1 RECs, which is the class that wind generated electricity falls into, is also variable but prices are presently high due to elevated demand. In fact, the prices are bumping up against the alternative compliance payments for the Class 1 RECs of $65/MWh. Alternative compliance payments are the fines that state-regulated utilities have to pay if they do not meet their renewable energy quotas and they set a cap on the REC market. Class 1 NH wind REC prices have risen from their lows of $15 in 2010 to their present value of about $62/MWh. Here is a link to a great article on recent Class 1 REC pricing.

 
Another revenue source for wind operations, albeit an indirect one, is that associated with production tax credits (PTCs) for wind generation. The PTC is a federal incentive program for the wind industry that provides producers of wind-generated electricity a tax credit of $23.00 for every MWh of produced electricity for the first 10 years of the project. I know the PTC is a tax credit and not a revenue item, but for the purposes of my analysis this week, I am including the revenue category. But to do so, I must calculate its before tax equivalent. A tax credit of $23/MWh is equivalent to a revenue item of $35.38 MWh for a company with a 35% federal tax rate. (This might not apply to a tax-evading company like Apple - but that is an axe to grind another day). The lower the tax rate, the lower will be the revenue equivalent.

In some cases, wind operations that sell electricity into the ISO-NE pool might receive payments for holding capacity available should demand increase and ISO-NE needs to draw on more generators. These payments can be considerable and for the Granite Reliable operation they are of the order of $151,000 per month. These are fixed payments but for the basis of my comparison, I have, on the basis of the Granite Reliable capacity payments, calculated them to be equivalent to $8.30/MWh (assuming a capacity factor of 0.25).


In summary here are the four main revenue components for the wind farms:
  • Electricity Sales - Presently these average about $82/MWh (2013 first quarter weighted average) but can range from $25 to $100/ MWh depending if sales are through a power purchase agreement or delivery into the ISO-NE electrical pool.
  • Sales of RECs – Presently about $62/MWh.
  • Revenue equivalent of production tax credits - $35/MW (dependent on federal tax rate).
  • Capacity payments – these are of the order of $8/MWh if a wind farm participates in the ISO-NE forward capacity market. Not all wind farms do.

The figure below summarizes the revenue flows.


These four revenue items total $187/MWh, which is equivalent to $0.187/kWh. Compare this to the ~$0.08/kWh we typically pay for energy portion of our electricity bills at our homes. I don't know about you, but I am impressed at the revenues the wind farms are earning. With this sort of revenue stream, wind operators clearly start each day with the prayer, "Blow Wind Blow"*. Needless to say, not all wind farms earn these revenue streams all the time but these numbers do indicate that wind farm revenue is a whole lot more than just the sale of electricity. Subsidies generated by  the RECs and PTCs provide 50% or more of the revenue  equivalents for these operations.

 
Of course, this is only half of the picture. Establishing wind farms is a capital-intensive and lengthy business and there are a lot of hurdles to overcome. For example, just this week we learned that the small 15 MW Kidder Mountain wind operation in the New Ipswich/Temple region will be scrapped. The developer, Timbertop Wind Energy, could not find a way to deal with the different ordinance issues presented by the two communities. The NH site evaluation committee declined to take jurisdiction of the project as the wind farm development was below 30MW. In my next post, we will take a look at the costs of establishing and running a wind farm.

Until next time, remember to turn off the lights when you leave the room.
 
Mike Mooiman
Franklin Pierce University

mooimanm@franklinpierce.edu
6/9/13


(*Blow Wind Blow – A classic Muddy Waters blues tune covered by a bunch of artists. Here it is by Eric Clapton. Enjoy.)


Click on this link to receive email notifications for Energy in New Hampshire updates