Saturday, November 1, 2014

Gonna Take You Higher* – Electricity Price Increases in New Hampshire

If you are a NH resident buying your electricity from Unitil, NH Electric Cooperative, or Liberty Utilities, you are most likely reeling from the recent increases in winter electricity rates. This post begins a series that takes a look at what makes up NH retail electricity prices and the reasons behind the large increases that we are seeing for certain utilities.

Historically, electricity prices have been on the rise. The chart below shows the 24-year historical average NH residential electricity prices.  In 1990, prices were about 10 cents per kilowatt hour (c/kWh) and then climbed to about 14 c/KWh in 1998. Prices then experienced a slow decrease until about 2002, after which they continued their increase to this past winter when we saw average prices of ~17 c/kWh. The trend from 1990 to 2103 represents a compounded average increase of 2.5% per year, which is the same as US inflation over the same period.


Source: EIA

The next chart looks at residential electricity prices for a shorter time period, and compares the NH prices (in green) to those of the NE states (brown) and to the average US monthly figure (blue) since 2000.


Source: EIA

NH has generally followed the NE average, but from 2006 to 2010 was quite a bit lower. However, over this period, our electricity rates have been about 40% higher than the national average.

State-by-state comparison is always useful and interesting. The figure below shows recent state rankings based on July 2014 retail electricity prices. The NE states are all in the top 11, with Vermont and Connecticut higher having higher prices than NH. Our electricity prices are the 7th highest in the US at 17.23 c/KWh − we can take some solace that the price in Hawaii is more than double the NH average. On the other hand, Washington state, which benefits from cheap hydroelectricity, has the lowest prices – almost half of NH’s at 8.96 c/KWh.


Source: EIA

All of the electricity prices I have presented so far are average prices and include all the charges you see on your electrical utility bill. Looking at an electricity bill is not unlike deciphering your cell bill. There are a lot of bits and pieces and it takes effort to understand them. There are three basic components. The first is the cost of power, which is usually a single line item for the cost of electricity per KWh. The second is the cost of getting the electricity to your home, i.e., the cost of distribution and servicing your account, which usually involves several line items, such a fixed account charge, a distribution charge, and perhaps even a transmission fee. Finally, there are all the odds and ends, such as taxes, charges for government-mandated programs, etc.

The reason for all these separate charges is, as I have noted previously in What’s It All About, Alfie?, is that there are three key parts to the electricity business: the generation of electricity, typically at a large power plant located in a central location; the transmission of electricity over long distances from the generation point to towns and cities; and the distribution of electricity through the community via the sub-stations, wires, and transformers to individual homes and businesses. Not all electrical utilities focus on all aspects of the business. Some, for example, such as my local electrical company, just distribute electricity. Others, such as the merchant wood-fired power plants or wind farms, just focus on generation, whereas utilities like PSNH are fully integrated organizations involved in all three aspects of the business. 


The biggest line item in your electrical utility bill is the cost of electricity. This is the focus for the rest of this post.

The electricity industry has been partially deregulated in NH and retail customers can purchase their electricity from different competitive suppliers. However, this electricity still has to run through the transmission lines and electrical wires of their local electrical utility and so customers are charged for the use of that distribution infrastructure.  Should a NH resident decide not to purchase electricity from a competitive supplier, the local electrical utility has the responsibility to source and supply the electricity to the customer. The utilities do so and apply their default electrical service rate. Although there has been competition on the residential supply side of electricity for a few years now, the majority of NH residential customers still rely on their local electrical utility company to source and supply their electricity. This is the reason that increases in default electrical service rates are so important.

There has been a good amount of reporting lately about the big increases in electrical service rates proposed by the utility companies and approved by the NH PUC.  The table below summarizes the present default electrical service rates as well as some information for previous years.  


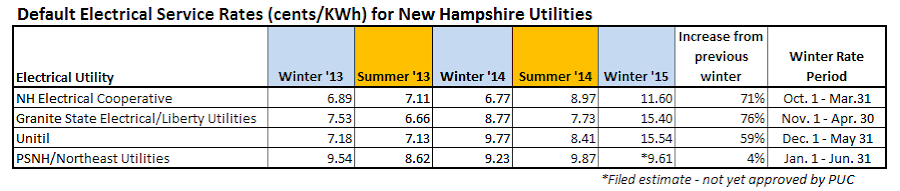
It is important to remember that these increases all relate to electricity supply (and not to transmission or distribution charges) so let’s take a closer look at the supply side of the NH utilities. The rest of this post focuses on the three utilities, NH Electric Co-op, Unitil, and Liberty Utilities, with approved increases. PSNH's default rates - which are not yet approved by the Public Utilities Commission - will be the topic for my next post. 

Expanding the supply aspect of the simple generation-transmission-distribution diagram presented above, the picture quickly becomes complicated because, as part of deregulation and the drive for competitive supply, we have introduced various intermediaries and market participants.

The electricity supply to residences by three of the four NH utilities (NH Electric Co-op, Unitil, and Liberty Utilities) is shown in the figure below. Competitive suppliers, shown in yellow, purchase electricity directly from generators (red) or through wholesale electrical markets (green). The second source of supply is from the utility itself, shown in blue, which needs to procure electricity for its default electrical service customers. The utility can purchase this electricity directly from generators but the bulk of the purchases are through wholesale electrical markets. There are two types of wholesale electrical markets – the forward sales and the spot markets. Generators sell electricity into both of these markets.  


In order to supply electricity to their default customers, the utilities have to forecast how much electricity will be required for a six-month period and then lock in the price of the forecasted amount of electricity in advance. This is carried out in the forward sales segment of the wholesale electrical markets. Although there is a cost associated with forward purchase commitments, they offer the advantage of locking in the rate of electricity purchases for the period. Should more electricity than forecasted be required, the utility has to purchase this extra electricity on the spot market.

Three NH utilities (NH Electric Co-op, Unitil, and Liberty Utilities) have just gone through the round of forecasting for this winter electricity supply. The utilities have estimated the number of default service customers and their total electricity consumption, and have gone out to markets and solicited bids for supplying this forecasted electricity through the winter months. The bids for Unitil and Liberty were reviewed, documented, and submitted as part of their default electrical service rate application to the NH Public Utilities Commission (PUC). The costs associated with these forward purchases of electricity are then included, without any mark-up by the utility, in the calculation of a single rate for winter months. The NHEC Co-op (NHEC) is unregulated and is not required to submit its rate adjustment calculation to the PUC.

The problem for default electricity customers is that the future prices for electricity for the next six months are high, as shown in the chart below. As the utilities lock in their supply and prices for the winter months, they are buying right into the winter price spikes.


The difficulty with this approach is that the utilities are trying to forecast in September what their electricity sales in the winter will be. This is an enormous challenge because they have to forecast how cold the winter will be, how many customers they might have and their consumptions. They must then commit to purchasing that electricity in advance. However, if the winter is mild, the spot price could be lower. Of course, the opposite could happen: it could be a brutal winter, natural gas consumption could be sky high, and electricity prices could skyrocket like last winter.  This is the challenge that the utilities and their regulators face. Is it better to lock in the price now – called “hedging” – or subject your customers to the gyrations of the spot markets where prices could be higher or lower than the forward market, or should some balance be struck between committing to a 100% hedge or a partial hedge? This is exactly the same decision we face at home. Do we commit to a fixed price for oil or natural gas over the winter months, or do we take our chances and hope it will be a warm winter and that oil and natural gas will be cheaper than that fixed-price contract. What would you do?

The regulators currently require Unitil and Liberty to hedge 100% of their six-month forecasted amounts and commit to the high winter prices. This has lead to the higher winter default service rates posted by these utilities.

This brings us to the question of why future prices for electricity are so high in winter.  In two words: natural gas. As we have closed down nuclear and coal-fired power plants in NE, we are now generating 46% of our electricity using natural gas. Depending on your viewpoint, that could be a good thing: it is a domestic fuel, cheap, and less polluting than coal. It does, however, make us very dependent on the natural gas market and fluctuations in natural gas prices. Natural gas is also used for heating and cooking and, in winter, we do not have the pipeline infrastructure to bring in enough natural gas for heating and electricity generation. During winter, the natural gas utilities and  electricity generators suck very hard on the end of the natural gas straw and when demand increases, markets do what they are wont to do and prices increase accordingly. When natural gas prices increase, so do the prices of electricity. NE has experienced price spikes for both natural gas and electricity during the past two winters, as shown in the chart below.

Source: ISO-NE

Sam Evans-Brown, in a recent NHPR report, does a great job of summarizing the natural gas situation in New England. The political cartoon by Bob Englehart of the Hartford Courant points to the irony of situation: there is an enormous amount of natural gas available in the US, but NE is at the end of the pipeline and that causes problems for us in the high-use winter months.


Bob Englehart

Hartford Courant

Dec 19, 2013


The future electricity prices are joined at the hip to the future natural gas prices. In the figure below, the leftmost chart shows the future prices of electricity and natural gas for the next three years, as provided by the forward markets. (The forward price of natural gas is calculated for the Boston Algonquin Citygate, which is a good proxy for NE natural gas pricing. See The Price for a discussion of natural gas citygate prices.) The winter spikes in forward electricity prices match the winter spikes in forward natural gas prices. Should you need convincing, the right-hand figure shows a direct and very strong correlation between future electricity  future natural gas prices. In fact, the correlation coefficient is 0.966, which indicates a super-strong correlation. (Correlation coefficients vary between 0 and 1. A coefficient of 1 indicates a perfect correlation, whereas a value of zero indicates no correlation.) Although correlation does not necessarily mean causation, in this case we can indeed be comfortable in concluding  that high future natural gas prices lead to high future prices for electricity.


Returning now to the table that shows the default service rates for the four utilities, we note that Unitil, Liberty, and NHEC reflect increases of 59%, 76%, and 71%, respectively, over last winter’s rates. Although NHEC also shows a large increase, their winter rates are substantially lower. Based on what I have been able to learn, these lower rates are due to diversification in the way NHEC purchases its electricity. NHEC does not hedge 100% of its forecasted needs just six months ahead. Instead, it commits to forward purchases many years out and to some just a few months out. It also purchases electricity directly from generators through long-term (20-year) power purchase agreements and will also purchase some of its power on the spot market where it is able to take advantage of lower spot prices at times. As an unregulated utility, NHEC clearly has more discretion than the regulated organizations and some might suggest that these direct comparisons are unfair. I disagree, because comparisons of these different approaches are important in trying to figure out what works best for NH ratepayers.

The Co-op model has a lot of attractive features. The customers are the shareholders and they are not incentivized by returns on capital or dividends. They want reliable supply and the lowest possible prices for electricity and the whole organization is focused to deliver this. With the other utilities, I don’t see the same incentives to keep down electricity prices. The regulated utilities, Unitil, Liberty, and PSNH, are required to pass on the costs of electricity to their customers without any mark-up so there is little motivation for them to search out alternatives to minimize energy prices.

NHEC has a long-term view of electricity prices and, to my mind, the “next six months” approach at Unitil, Liberty and PSNH, as required by regulation, is far too short-term. Wholesale reliance on short-term forward markets does not seem to be the best approach. There is certainly merit to the diversification and flexibility of supply model used by NHEC and I wonder whether consideration should not be given to incentivizing the regulated utilities to develop a longer-term view of electricity supply. One way to do this may be to allow the utilities the flexibility to diversify their electricity supply and reduce the price of electricity below that of the short-term forward markets and to share significantly in any resultant savings.

While researching this post, it struck me that there is considerable variety in the types of electrical utility and a great deal of experimentation occurring in NH. NH arrived early to the deregulation ball and then pulled back when things went awry in California (see Should l I Stay or Should I Go?). As a result we have an integrated utility, PSNH, still in the generation, transmission, and distribution business; we have two deregulated utilities, Unitil and Liberty, that are out of the generation business and who buy all their electricity on the wholesale markets; we have a cooperative in NHEC which is not regulated by the NH PUC; and we have a few municipal electric companies. With all of these options in NH, we have a unique opportunity to figure out which model is the best, and which consistently and reliably delivers low cost electricity to NH ratepayers.

The past two winters have seen a refrain of “Gonna Take You Higher”* and I anticipate that the NH annual average electricity price will rise again this year. When deregulation was introduced, we expected the markets to automatically deliver lower electricity costs. This has not always happened. Sure, we have run into cold winters, natural gas pipeline capacity issues, and the shutdown of nuclear and coal plants, but deregulation appears to have fallen short on some of its promises. This requires some reflection and is certainly worthy of a future blog post.

Electricity markets are different from other energy markets, many of which have an inventory buffers in the form of storage or stockpiles to overcome temporary interruptions and market dislocations. Electricity, on the other hand, needs to be simultaneously generated and consumed: it cannot be stored, and the underlying market components and structures are hellishly complicated. There are a limited number of market players, liquidity can be problematic at times, and − regardless of the cost − it needs to be “on” all of time. Moreover, in NE, the market for electricity now rests on top of the local market for natural gas – another commodity for which local storage is very limited and where delivery constraints come into play. With so much of our electricity dependent on natural gas, we could even reach situations where there is insufficient natural gas to generate the electricity we need. From this viewpoint, it appears that heavy dependence on natural gas has compromised the reliability of our electricity supply. This is all frightfully messy.   

I am a proponent of the letting the invisible hand of the market do its work, but it does need to do so under the very visible and intelligent hand of regulation. My 1/8 of a KWh worth is that progress has been made but there is still work to do to get things right for NH electricity rate payers.

Until next time, remember to turn off the lights when you leave the room.

Mike Mooiman
Franklin Pierce University
mooimanm@franklinpierce.edu


(*Gonna Take You Higher – A line from the chorus of Sly and the Family Stone’s tune,  Want to Take You Higher, and a great example of the funky soul music from the 1960s. This was one of the tunes in the Family Stone’s set at Woodstock when they played it at 3 am and had the crowd chanting “Higher”. Here is a video of a 1969 show that gives you a sense of the power and drive of Sly and the Family Stone. Enjoy I Want to Take You Higher.)


Monday, October 13, 2014

River’s Gonna Rise* - Hydro Power in New Hampshire – Part 3: PSNH Hydro Operations and River Flows

In my last few posts, Down by the Water  and Take Me to the River, I mentioned that my office looks onto the Merrimack River and the upstream Amoskeag hydroelectric operation that has been producing electricity for the past ninety years.  From this view, I often take note of river flows and whether the water is spilling over the top of the dam wall, as in the photograph below. In this post, I discuss the variability of river flows and how hydro plant electricity outputs are very dependent on these. I also look at the capacity factors of the Merrimack River hydro operations and compare them to national averages.


Weather and precipitation are the most important variables in hydro electricity operations because these determine river flow. I dug up some relevant information about Merrimack River flows near my office from the United States Geological Services (USGS). The chart below shows the river flows at the Goffs Falls monitoring point, which is just downstream of the Amoskeag Dam. The jagged blue line shows the data for 2013 and it is surprising how variable the flow is from day to day. The orange dots show the average flowrates over the past 76 years. This historical data shows that river flows generally rise during April to June due to snow melt, reaching flows that are four times the average value, and then drop off considerably during the dry August to October period, to about one quarter of the average. Interestingly, the summer of 2013 was a wet one, as indicated by the higher-than-average river flows during this period.

Source: USGS

A simple relationship dictates the generating capacity of a hydro operation:

Power = Constant x Flow x Height

In an operation such as Amoskeag, the height (or head) is essentially fixed because this is a constant-level run-of-river operation. However, since Merrimack River flows do vary, I took a look at the 2013 monthly river flows and compared them to monthly electricity production (measured in MWh) for the two larger operations on the Merrimack River. These are plotted in the figure below on the left, with river flows in the green bars, and Amoskeag and Garvin Falls electricity generation in blue and red, respectively.


Data Source: USGS and EIA

As expected, high river flows, particularly during the April snowmelt or the wet July of last year, generated higher amounts of electricity.  Low river flows, such as in the dry months of August to October, were associated with lower generation rates. 

The chart on the right plots energy generation against river flows for the Amoskeag plant. I was somewhat expecting a 1:1 linear relationship and was initially surprised to note how generation tended to start leveling off at high flowrates. However, the PSNH hydro folks pointed out that the maximum flowrate through the Amoskeag turbines is 5000 cubic feet per second (cu. ft/sec), so one would expect to see generation level off above this flowrate. Moreover, an average monthly flowrate of greater than 5000 cu. ft/sec does not necessarily mean that flow rates are higher than 5000 cu. ft/sec for 24 hours a day – there may be periods when it is substantially higher and then there are periods of lower flows.

In one of my recent posts, Down by the Water, we noted the simple mathematical relationship between energy and power:

 Energy = Power x time.

Applying this relationship to the Amoskeag operation, which has a nameplate capacity of 16 MW, and assuming 30 days per month and 24 hours per day of operation, the maximum monthly generation from the Amoskeag Dam can be calculated as

Energy = 16 MW x 30 days x 24 hr/day = 11,520 MWh

This is pretty close to the maximum monthly generation output on the chart above.

I was also surprised to note that the power generation of Garvin Falls was half that of Amoskeag although its generation capacity (12 MW) is 75% that of Amoskeag (16 MW). Calculating the total generation for both operations for 2013, I noted that Amoskeag produced 66% of its maximum electricity output (also termed its capacity factor), whereas Garvin Falls produced only 44%. It turns out that Garvin Falls is a more troublesome operation because it has a gatehouse and a narrow channel for a head race that is used to direct water into the power houses. River-borne debris, such as leaves, branches, trees, etc., build up behind the gatehouse and restrict flow to the channel, which significantly compromises the steady generation of electricity from this operation. Regular maintenance, involving the removal of debris from the screens where the water enters the power house, is required.

The Energy Information Agency, EIA, produces an average annual capacity factor for all hydro operations across the US. In 2013 it was 38.1%, which is much lower than I would have anticipated. I was expecting capacity factors for hydro operation to be of the order of 80% or so but the annual data from 2008 to 2013 shows US capacity factors ranging from 37.2% to 45.9%. The national data does indicate that the Garvin Falls and particularly the Amoskeag operation have capacity factors greater than the average US hydro operation.

There are several reasons for these lower-than-expected capacity factors for hydro operation:
  • Precipitation and river flows are variable and the maximum flow of water that the generators can handle is not always available.
  • River-borne debris and winter ice can at times significantly compromise water flows into the generating units.
  • The generating units need to be slowed or shutdown for periodic maintenance.
  • Even though hydro plants are generally the lowest cost producers of electricity when selling into the wholesale markets, they can be underbid by other generators, particularly heavily subsidized wind operations which will sometimes even pay to produce electricity. At times like these, there might not be any call for hydro power and the units are shutdown.

PSNH owns and operates several hydro operations in NH. Those listed below are owned and operated by Northeast Utilities, the parent corporation of PSNH.


Based on recent documentation submitted to the NH Public Utilities Commission, hydro operations will be responsible for about 11% of  the ~3,016,000 MWh of electricity that PSNH is planning to generate from its own facilities in 2014. These are PSNH’s lowest cost electricity generators and are thus an important asset to keep in operation and perhaps even consider expanding, even though the impacts of new or expanded hydro operations could be considerable and permitting could be extremely difficult. We have to recognize that there is a price to be paid for every energy source we use but, unlike fossil fuels where every ton of carbon dioxide we dump into the atmosphere intensifies the green-house effect, hydro plants will be still generating electricity one hundred years from now and will still not be pumping carbon dioxide into the atmosphere.

An important debate regarding these facilities is presently underway in NH (discussed in Should I Stay or Should I Go). In order to complete the electricity deregulation process in New Hampshire, it has been proposed that PSNH should be compelled to sell these hydro generating operations, along with their wood- and gas-fired operations and the large coal-burning plant on the Merrimack River in Bow. However, with electricity prices shooting up this winter and with PSNH customers, for the time being at least, somewhat shielded from these increases, this does give one pause for thought and to consider that ownership of generating operations may perhaps have some benefits. This is certainly a topic I will return to in a future post.

Until next time, remember to turn off the lights when you leave the room and, if it is raining, contemplate that the river’s gonna rise* and the hydroelectricity output will increase.

Mike Mooiman
Franklin Pierce University
mooimanm@franklinpierce.edu


(*River’s Gonna Rise – An instrumental tune by Patrick O’ Hearn, a LA bass player and electronic musician who has had a long and varied career, including stints playing bass in Frank Zappa’s band, the New Wave group, Missing Persons, as well as releasing over a dozen solo albums featuring electronic and ambient music. He is well known for his film scores and in the past few years has been playing bass in John Hiatt’s band. Here is the title track from Patrick O’ Hearn’s 1988 album River’s Gonna Rise.)

Sunday, October 5, 2014

Take Me to the River* - Hydro Power in New Hampshire – Part 2: Touring the PSNH Hydro Operations

In my last post, Down by the Water, I noted that my office looks onto the Merrimack River and the upstream Amoskeag dam and the hydroelectricity power plant that has been in operation for ninety years. In this post, I take a closer look at this power plant, which I had an opportunity to tour, as well as its sister upstream plants in Hooksett and at Garvin Falls. 

In the process of learning more about the operation of the Amoskeag Dam and the hydro plant, I was fortunate enough to be given a tour of the operations by the experienced hydro team at PSNH. The photographs below were taken during this tour. My tour of the facility was fascinating. I got a great view of the dam from the powerhouse side and was able to view the power plant from the inside.


The power plant is home to three 1920s vintage turbine and generator sets, which continue to work perfectly today and are so well designed and maintained that replacement is not warranted. As an engineer, I was very impressed to see these 90+-year old units still operating and generating electricity. The hydro industry is rather unique in the electricity generation business, in that many of the operations rely on old, well-designed equipment, which, in some cases, are 100 years old. This is a testament to past engineers who designed these units without the use of calculators, spreadsheets, or computer-aided design and drawing tools.


The Amoskeag Power Plant has a long history. The project was started by the Amoskeag Manufacturing Company, the textile manufacturing company established on the banks of the Merrimack River and which led to the founding of Manchester. The Amoskeag Mill was at one time the largest cotton textile plant in the world. At its peak, the mill was powered by thirty water turbines, twelve steam engines, and five steam turbines.  In 1918, a decision was made to completely dam the Merrimack at the Amoskeag Falls and to install a hydroelectric generating station. This was placed into operation in 1924.

During my research I was excited to uncover the photograph below from the PSNH Shoebox website, which is a collection of old PSNH-related photographs. This  shows one of the turbines being readied for installation in the Amoskeag powerhouse in the 1920s. It is still in operation today.

Photo: PSNH Shoebox

After World War I, business became difficult for the Amoskeag Manufacturing Company because the US was in recession. Furthermore, the proliferation of electrical generating operations throughout the US, and especially down south, meant that cotton did not need to be transported north to be milled and woven. High costs, aging equipment, and labor unrest eventually led to the bankruptcy of the Amoskeag Manufacturing Company and the sale of the hydro operations to PSNH in 1936.

The Amoskeag Dam spans the Merrimack River so that the river flow can be harnessed and fed through the three turbines at the Amoskeag Powerhouse (see photograph below). The average annual river flow is some 4000 cubic feet per second (cu. ft/sec) (equivalent to 1.8 million gallons per hour). At full power, the maximum combined water flow through the turbines is 5000 cu. ft/sec. This means during average river flows of 4000 cu. ft/sec, all the water, except for a 280 cu. ft/sec habitat bypass,  is directed through the turbines and there is no overflow over the top of the dam. My photographs of the water overtopping of the Amoskeag Dam were taken during the tour. Because the river flow that day was very low (~ 2000 cu. ft/sec), I was surprised to see overtopping. It turned out that the Amoskeag power house was down for maintenance because the transformers were being replaced so there was no river flow going through turbines and the full river flow, except for the bypass, was consequently all spilling over the top of the dam.

I was also fortunate to be taken down to the lower levels of the powerhouse, where I walked to the other side of the dam through a service tunnel inside the dam wall that runs along its entire length. On emerging on the other side, I got a closer look at the inflatable gate that is used to control the height of the water in the dam.


The Amoskeag dam is just one of three hydro plants operated by PSNH on a fairly short stretch of the Merrimack river, so I decided to take myself to the river* and drive upstream to visit the other two. About 7 miles above the Amoskeag dam, there is a small single turbine 1.6 MW hydro plant on the Hooksett dam;  a further 5 miles upstream is the much larger Garvin Falls Dam, which hosts four turbines in two powerhouses which have a combined capacity of 12.1 MW. The PSNH Merrimack coal-fired power plant, which uses the Merrimack River as a cooling water source, lies between these two dams. It is clear that, even today, the mighty Merrimack has an enormously important role to play in energy generation in New Hampshire. Below are some photographs from my upstream excursion.


Much of this post has been touristy in nature with descriptions of power plants, tours and lots of pictures but in the next post I will dig deeper into the technical information, such as river flows and electricity generation, associated with these hydro operations. My visits and research for these posts has given me a better understanding of the operation and importance of these hydroelectric facilities as well as a much better appreciation for the engineering design and construction skills of those old time engineers.

Until next time, remember to turn off the lights when you leave the room.

Mike Mooiman
Franklin Pierce University
mooimanm@franklinpierce.edu


(*Take Me to the River – The fabulous and heavily covered Al Green tune. The definitive cover is by the Talking Heads. Here it is from one the best concert movies ever made – “Stop Making Sense”. Turn up the volume and enjoy Take Me to River.)


Sunday, September 21, 2014

Down by the Water* - Hydro Power in New Hampshire – Part 1

My office is in Manchester, in Franklin Pierce University’s graduate school which is located in one of the renovated mill buildings located on the Merrimack River. From the conference room there is a great view of the river and the upstream Amoskeag dam. This is a 30-foot high, 710-foot long concrete dam that holds back the Merrimack River at this point so that the water can be directed through the turbines at the Amoskeag Power House located on the western bank of the Merrimack.  These turbines have a combined generating capacity of 16 MW. The photos below show my view of the dam wall and a Google Map satellite image for an overhead view. This dam was originally commissioned in 1924 to service the Manchester mills. While gazing at the river this week during a meeting, I decided it was time to turn my attention to the topic of hydro power in New Hampshire. This post is the first in a multi-part series on this topic.

Man has utilized the power of water (hydro power) for centuries. In the late 1700s and into the 1800s, advances in technology, powered by running water (and eventually by steam) is what lead to the industrial revolution. Throughout New England, textile mills were established along the main rivers, most notably the Blackstone River that runs down through Worchester, Massachusetts into Rhode Island and the Merrimack River that follows a route through New Hampshire into Massachusetts. The river flow turned water wheels and turbines which, through a system of gears, shafts, and belts, were used to drive machinery inside the mills.

In the 1880s, water-driven turbines were combined with electric generators to generate the first hydroelectricity, and in 1882 the world's first hydroelectric power plant started operation on the Fox River in Appleton, Wisconsin. From that point on, the use of hydroelectricity grew phenomenally and, in 1940, hydro generated 40% of all electricity in the US. Since then, demand for electricity has increased ten-fold, but natural gas-, coal-, and nuclear-fired operations were established to fill the need. Hydro power output grew, but its share of electricity production has dropped off to about 6 to 8% of the electricity generated in the US today.

Hydro operations range in size from the very large 6809 MW Grand Coulee Dam in Washington state, the 2515 MW of the Robert Moses Niagara Power Plant and the 2080 MW of the Hoover dam on the Colorado River to “hobby” projects less than 1 kW in capacity. (Remember there are 1000 kW in a MW.) There are about 1750 hydropower operations in the US: most of them are much smaller than in size than the very large Hoover Dam operation which we usually associate with hydropower.  In fact, most hydroelectric operations in the US are much smaller - almost 90%  are less than 30 MW in size.
Hoover Dam Hydroelectric Plan

All hydropower operations, whether private, municipal, or state-owned, are licensed by the Federal Energy Electricity Commission  (FERC) – the  federal “godfather” of the electricity business. There are 41 FERC-licensed hydro operations in NH, ranging in size from 136 MW to 58 kW.  Small projects, such as those less than 10 MW installed on an existing dam or those of less than 40 MW installed on a waterway used for another purpose (such as an irrigation canal), are exempt from FERC licensing. There are 43 such exempt facilities in NH, ranging from the 3.5 MW Gregg’s Falls operation on the Piscataquog River in Goffstown to a 5 kW operation on Marden Brook. FERC licenses often involve combinations of hydro operations run by a single operator on a stretch of water:  for example, the three PSNH operations on the Merrimack River are combined into one license. I also noted that the very large Moore and Commerford hydro plants on the Connecticut River are listed by FERC as Vermont operations. These licensing/classification artifacts can cause confusion, especially when data on generation, as provided by the Energy Information Agency (EIA) and used later in this post, is reviewed.

There are many different ways of classifying hydro operations. The first is by size. Large hydro plants in the US are generally considered to be those above 25 MW in capacity but international standards consider those above 10 MW to be large. Most of the hydro plants in New Hampshire are small operations: within this class there are subclasses which typically have the following size ranges:

·                                Mini                <1 MW
·                                Micro              <100 kW
·                                Pico                <10 kW
·                                Family             <1 kW

To give you a sense of what these capacities mean, it is important to remind ourselves of the difference between power and energy.  I discussed this topic in the I’ve Got the Power! blog a while ago. As a reminder, remember that electrical energy is the ability of an electric current to do work − such as producing motion, heat, or light. The units of electrical energy are kilowatt hours (kWh) or megawatt hours (MWh). There are 1000 kWh in one MWh. Electrical power, on the other hand, measured in kilowatts (kW) or megawatts (MW), is a capacity, i.e., the rate at which energy can be produced from a generator. Large generators, which can produce more energy per unit of time, naturally have larger capacity or power ratings.

The confusion between power and energy often stems from the similarity of the units: kilowatt hours or megawatt hours are energy units, and kilowatts or megawatts are power units. However, it is important to understand that even though the units seem similar, there is a world of difference between them. This difference stems from the simple mathematical relationship between energy and power;

Energy = Power x time.

I find it is always useful to understand these relationships from a homeowner’s point of view. Consider that an average US household uses 11,000 kWh per year of electricity (~900 kWh per month). If you had to generate that electricity yourself and you were going to do it over 24 hours a day for 365 days per year, you would need generator with a power rating of 1.3 kW.

The calculation would be done as follows:

Energy = Power x time
Power = Energy / time
Power = 11,000 kWh/(365 days x 24 hours/day) = 1.3 kW.

Of course, this calculation is based on a daily average, but our daily electricity use is actually rather “lumpy”:  there is a first peak in the morning as we turn on the lights, make coffee, heat up the house, and take hot showers, followed by a second and larger peak in the late afternoon/evening when we are making dinner, watching TV, doing the laundry, turning on the electric blanket, reading this blog, etc. If you were to actually buy a generator, you would want a unit that has a capacity of more than the average 1.3 kW so that it could handle the peaks in usage. This is why backup generators for homes often have sizes of the order of 5 kW to 15 kW. But I digress somewhat (I may come back to the topic of home generators in a future post)….

The second classification of hydro plants is by type of operation. The three main types are:

  • Reservoir or Pond-and-Release Operations: We most commonly associate these with hydropower and they involve large concrete dams holding back enormous reservoirs of water with the power plant at the base, as shown in the Hoover Dam picture above. The reservoir provides for a great deal of storage and steady power generation even during the dry season. These operations usually involve the upstream flooding of large tracts of land and significantly impact downstream water flows. The water level in the reservoir can also fluctuate greatly, depending on the incoming water flows and the discharges through the power station.
  • Run-of-River Operations: These hydroelectric plants depend on the natural drop in the river elevation. A portion of the upstream river flow is sometimes diverted through a large pipe (called a penstock) to a downstream generator plant, after which the water flow is reintroduced into the river (see the figure below). These operations often have dams at the upstream location to provide the water diversion point but their storage capacity, called pondage, is limited and, as such, these operations are more subject to the vagaries of seasonal precipitation and natural river flows. With limited storage, the reservoir level tends to remain fairly constant – excess river flow simply spills over the top of the dam. Electricity production can therefore vary substantially over time. Because these operations don’t involve large amounts of storage or flooding of large acreages of land, they tend to viewed as more environmentally friendly or “greener” than the larger reservoir operations.
  • Pumped Storage: These operations involve pumping water from a river uphill to a reservoir at a higher elevation during low electricity demand and low cost periods. When electricity demand increases and prices are high, these operations then run in reverse and the water in the reservoir is drained through a turbine back into the river, generating electricity in the process. There are a three of these operations in New England with a combined capacity of 1696 MW.


Source: IPCC

In NH, we do not have any pumped storage operations but we have reservoir and run-of-river operations.  Data from the EIA indicates that there are 92 hydro generators in NH with a combined name-plate capacity of 446 MW and a total winter capacity of 511 MW. The ten largest NH hydroelectric operations are listed below.  The Moore and Comerford dams, located on the Connecticut River which runs between New Hampshire and Vermont, are the largest hydro operations in all of New England. All operations listed are individual dams, except for the Great Lake Hydro-owned operation on the Androscoggin River in the Berlin area which is a series of different dams and 21 generating facilities. The largest PSNH-owned operation in NH (and the one that distracts me during meetings)  is the Amoskeag dam on the Merrimack River.


Source: EIA

As a wrap-up for this post, I thought a comparison with other New England states would be interesting. The table below lists total electricity production capacity (the power of the generator) and hydro capacity by state for 2012, as well as total production of electricity and hydroelectricity. The data include conventional hydro only and excludes pumped storage operations. We can see that Maine is the “hydro powerhouse” of the New England region, with the largest capacity, followed by NH. The upper New England states, New Hampshire, Vermont, and Maine  provide the bulk of the region’s hydro generation capacity.

I note with interest that, even though Maine total hydro capacity was only 17% of its total generating capacity, 26% of their electricity output for 2012 was generated from hydro. This means that their hydro plants worked very hard in 2012, which is indicated by the highest capacity factor for their combined hydro plants. (Recall from I’ve Got the Power! that capacity factor is the ratio, expressed as a percentage, of the actual electricity output from a generator over a year compared to the theoretical output if the unit operated 24 hours/day 365 days per year.) The comparative numbers for NH are quite different. In orange I have highlighted that hydro represented 10% of NH generating capacity but, in 2012, it was, surprisingly, only responsible for 7% of the NH total electricity output. The capacity factor of all NH’s hydro plants, in yellow, was therefore an extraordinary low 33%.


Source: EIA

This anomaly is quite striking and some follow-up research is warranted. It is clear that hydro power is intriguing topic and I plan to continue my explorations in future posts. Now, when I gaze out the windows at the Merrimack River and the upstream Amoskeag dam during faculty meetings, my colleagues can be assured that my distraction is not idle daydreaming; instead I will be thinking of river flows, generating plants, and capacity factors!

Until next time, remember to turn off the lights when you leave the room.

Mike Mooiman
Franklin Pierce University


(*Down by the Water – A great tune by one of my favorite indie groups, The Decemberists. These guys are great song writers and I always look forward to their new releases. Here they are from Austin City Limits – the best music show on TV. Enjoy Down by the Water.)


Saturday, August 23, 2014

Extraordinary Machine* - ISO New England

I had the opportunity early this summer to take a week-long course from the folks at ISO New England (ISO-NE) on Wholesale Electricity Markets.  ISO-NE is the regional organization that is essentially responsible for keeping the lights on in New England. ISO stands for Independent System Operator. This is the organization that coordinates the generation and transmission of electricity in New England through a variety of regulated and free market mechanisms.

In previous blogs, What’s It All About, Alfie? and Wind in the Wires, I discussed the structure of the utility industry and particularly the electrical utility industry. There are three aspects to the electrical utility business, as shown in the figure below: there is the generation of power, typically at a large power plant located in a central location, then there is the transmission of electricity over long distances from the generation point to towns and cities, and, finally, there is the distribution of electricity through the community via the sub-stations, transformers, and wires to individual homes and businesses. 


ISO-NE is the organization that coordinates the generation and transmission aspects of the electricity business. It is your local electrical utility, such as PSNH, Unitil, or Liberty Utilities, that is responsible for the distribution step, which involves drawing the electricity from the transmission lines and getting it to your home and place of work. ISO-NE is not reading your individual electrical meter - that is also the task of your local electrical distribution company. It is important to note that ISO-NE does not own or operate generation plants or transmission lines. Instead, through a variety of market mechanisms, it is responsible for the coordination of generation and supply by a host of generation and transmission companies.

This turns out to be an extraordinarily complicated task because electricity cannot be stored (or very little of it) and so there needs to be a consumer for every electron of electricity produced by a power generation plant at every minute of the day. When you increase your demand for electricity by turning on your laptop or tablet to read this blog, someone needs to ensure that generating companies are supplying just the right amount of electricity to do so: that is what ISO-NE does.

ISO-NE operates the electrical grid in the six New England states of New Hampshire, Vermont, Maine, Massachusetts, Rhode Island, and Connecticut and has three primary responsibilities:
  1. Operating the Power System: ISO-NE ensures the correct balance between electricity supply and demand every minute of the day by centrally coordinating the generation and transmission of electricity in the New England region and into (and from) other neighboring regions, if necessary.
  2. Supervising Wholesale Electricity Markets: ISO-NE provides and supervises the market platforms on which wholesale electricity is bought and sold.
  3. Power System Planning: ISO-NE assures that present and future electricity needs are meet through the development of reliable generation and transmission systems.
In the days before electrical deregulation, electrical utilities, such as Public Service of New Hampshire (PSNH), were given a monopoly to provide electrical service to large regions. As such, the utility was responsible for the generation, transmission, and distribution of electricity across the region. This was done largely through operating its own generation plants, running the electricity through its own transmission lines, and supplying it to its own customers through its own distribution network. However, as noted in Shall I Stay, or Should I Go?, this model has changed as consumers have demanded choice and competition. We have been swept up in the deregulation wave that has worked to unbundle the electrical industry and break it up into separate generation, transmission, and generation companies, and to allow competition in each of these areas. Although deregulation has had varying levels of success, it soon became clear that this environment required a single controlling entity to coordinate open access electricity supply, transmission, and use across all a range of independent and competitive regional companies and regulated utilities, hence the need of an Independent System Operator such as ISO-NE. 

The seeds for ISO-NE were sown in the 1965 Northeast blackout that affected some 30 million people in Ontario and large parts of New England, New York, and New Jersey. This blackout was caused by a single poorly set relay at a New York power plant that created a series of cascading electrical surges, tripped relays, and imbalances that moved through the electrical grid and shut down generation plants. In the aftermath of the blackout, several reliability councils were set up to improve coordination between electrical utilities. One of the organizations formed in 1971 was New England Power Pool (NEPOOL), which was a trade organization of New England power companies. The focus of their work was to improve cooperation and coordination among the regional power utilities. In the process, they organized much of the NE electrical grid and established a central electricity dispatch organization.

For almost three decades, NEPOOL was responsible for the coordination of the NE electrical grid, but, in the 1990s, with the advent of deregulation, the Federal Energy Regulatory Commission (FERC) – the Federal “godfather” of the electricity business – decided that deregulation required open access to the electrical grid by independent power companies and well-run competitive markets. FERC concluded that this was best done under the auspices of an independent organization, rather than a trade organization of existing participants which may not be open to increased competition. ISO-NE is one of several regional organizations that were established in 1997 to monitor deregulation, establish open and competitive wholesale markets, as well as coordinate and operate the regional electrical grid. Essentially ISO-NE assumed some of the functions that had been carried out by NEPOOL. In 2005, FERC provided ISO-NE with greater authority and independence over the transmission grid and designated it as the six-state Regional Transmission Organization or RTO. The map below shows the location of other ISOs or RTO in North America.

Today, ISO-NE is responsible for over $10 billion of wholesale electricity transactions from 400 market participants. It is a private, non-profit organization with operations located in Western Massachusetts. It has about 550 employees, most of whom are power system engineers, computer scientists, and economists. ISO-NE does not have trucks and power line crews that go out repair the grid. That is the responsibility of the transmission and distribution companies. The ISO-NE folks do not get their hands dirty: it is a coordinating, monitoring, and planning body for the electrical grid.
Here are some key facts about ISO-NE:
  •    Serves 14 million residents with 6.5 million meters across six NE states;
  •    Coordinates 32,000 MW of generating capacity;
  •    Coordinates 350 generators;
  •    Covers 8400 miles of high voltage transmission lines;
  •    Highest peak demand for electricity ever recorded is 28,130 MW;
  •    Peak load in 2013 was 27,379 MW;
  •    Generation of electricity in 2013 was 129,336,000 MWh;
  •    Average Day Ahead Wholesale Price in 2013: $ 54.42/MWh (= 5.4 cents/kWh);
  •    $8 billion in transactions from electricity sales in 2013;
  •    2013 operating expenses: $157 million.


ISO-NE Control Room (Photo Courtesy of ISO-NE)


ISO-NE has created several markets, the most important of which is the wholesale market for buying and selling electricity and which accounts for the bulk of ISO-NE transactions. Another important and growing function is the capacity market, which is a forward market in which bidders commit generation capacity that will meet the electricity needs in the future. For example, a new start-up power plant can auction off its generation capacity to supply electricity in three years’ time. Of course, if this future capacity is bought, the start-up is obligated to deliver that generating capability in three years. This market provides an additional revenue stream for power plants, it allows capacity planning at least three years out, and it provides incentives for the construction of new power plants.

As a result of my research, I now have a much better understanding of ISO-NE and their function. My most important takeaway, however, was that I was simply stunned at the engineering and economic complexity involved in getting electricity from generators, moving it across transmission lines, and getting it to users in a complex deregulated market. As I noted earlier, ISO-NE folks do not get their hands dirty repairing transformers and power lines but they have built and are responsible for a very complex machine. A useful way of understanding this machine is to view it, as other authors have, as a mechanism responsible for controlling three types of flows, as in the figure below.  It is responsible for the flow of information about generation, transmission, and demand, which leads to transparent market operations and both short- and long-term planning for the electrical grid. It is also responsible for the coordination and flow of electricity from generators to users across transmissions lines. Finally, through its market mechanisms, it is the conduit for money flows from buyers of electricity or generation capacity to sellers.


I am very impressed with this machine and now understand more completely the need for an organization like ISO-NE. We often hear grumbling in NH that we export a great deal of the electricity we produce. That is true, but only up to a point. It is important to understand that NH is not an “electrical island” responsible for its own generation and use of electricity. That is old school “PSNH will take care of everything for New Hampshire” thinking. We now live in a time of deregulated (or partially deregulated) markets. The State of New Hampshire is part of the New England grid and, along with our neighbors, we generate, transmit, and use electricity. Largely due to the Seabrook Nuclear Plant in Portsmouth, we presently generate more than we use so other NE users benefit from NH generation capacity, but, should there be an interruption of supply from Seabrook, we will be very grateful that we are indeed part of the NE grid. Likewise, access to the NE markets allows us to participate in long-term planning and in large wholesale electricity markets whose structure and competitive nature work to keep wholesale electricity prices down.

There is, of course, a cost associated with a controlling body such as ISO-NE. The 2013 operating expense for ISO-NE was $157 million, which we as rate payers end up paying for. If we divide the costs of ISO by the electricity produced in 2013, this yields a figure of about 0.11 c/kWh. For an average household using 800 KWh per month, the ISO-related costs turn out to be about a dollar per month. From my perspective, that is cheap insurance for a reliable electrical supply and efficient markets.

Until next time, remember to turn off the lights when you leave the room—and when you do so, think about the extraordinary machine* that adjusts to that small reduction in electrical demand. It is indeed remarkable.


Mike Mooiman
Franklin Pierce University

(*Extraordinary Machine – A cool little old timey tune by the extraordinarily talented Fiona Apple. Here is a performance from the Today Show. Enjoy.)