Pages

Monday, April 24, 2017

The Regional Greenhouse Initiative - Part 2

In Part 1 of this series of posts on the Regional Greenhouse Gas Initiative (RGGI), I reviewed how money flows from ratepayers, to the utility companies, to the electricity generators, to the participating states, and then back to the ratepayers as direct bill rebates or to investments in energy-efficiency (EE) initiatives. With an understanding of what happens to our ratepayer dollars in this program, let’s now take a look at the actual allowance caps and what has happened to regional carbon dioxide (CO2)  emissions since the program was implemented in 2008.

The chart below presents data on the emission caps, the actual CO2 emissions from power plants in the RGGI states, as well as the average prices achieved in the RGGI auctions of emissions allowances. The first regional cap (shown in blue) was implemented in 2009. For the first few years of the program, actual emissions (shown in green), which were already trending downward due to extensive use of natural gas generation, were substantially lower than the cap. This made compliance easy and resulted in lower prices for the allowances (as shown on the bar graph). In 2014, after a review of the program, there was a big downward adjustment in the cap and the compliance margin narrowed considerably.


The intent of the shrinking cap in cap-and-trade program is to issue fewer emission allowances every year. In theory, this should increase allowance prices and make fossil fuel operations with high CO2 emissions, such as coal plants, the more expensive producers in the electricity marketplace. High generation prices would force these operations out of business or drive them to make changes to reduce carbon emissions. However, during the first period of the RGGI program from 2008 to 2014, when the cap was so much higher than the actual emissions, allowances prices were low (of the order of $2 to $3/ton CO2) and RGGI participants were able to buy and bank over 120 tons of emissions allowances. This is more than one year’s worth of allowances.

The problem with these banked allowances is that they can be used at any time, so their availability puts downward pressure on the prices at auction. To take this large volume of banked credits into account and flush them out of the system, the RGGI program then implemented a further downward adjustment in the cap in 2014 – the Adjusted Cap (shown in red). With this change, actual emissions are now well above the Adjusted Cap and it is anticipated that this will increase the price for emissions allowances and draw those banked credits into the market. With these changes, allowance prices did indeed rise in 2014 and 2015; however, since 2016, when the Supreme Court suspended implementation of the Clean Power Plan and Donald Trump, with his antagonistic view of regulation,  was elected President, allowance prices have again fallen. There is also an interim review of the RGGI program underway, so participants are awaiting its outcomes and indications as to what the caps will be after 2020. The successful continuation of the RGGI program, the magnitude of the future caps, and the utilization of the banked allowances should have a significant impact on allowance prices going forward.

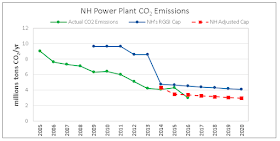
Carbon emissions from power plants in NH have also fallen, as is evident from the figure below, which also shows the NH-specific RGGI caps and adjusted caps.  Emissions from NH operations dropped by 67% since 2005, compared with a 56% decrease for all the RGGI states. A great deal of this improvement was driven by reduced in-state coal-fired generation. Even with the adjustment, NH CO2 emissions were below the cap in 2016.  In the RGGI states, there are over 160 carbon-emitting generating operations that need to comply with the program, but, of the 31 generating plants in NH, only five  (Merrimack, Schiller, Newington, Granite Ridge Energy, and Essential Power Newington Energy LLC) are affected.  


In these first looks at the RGGI program, I have taken a rather simple view of the program by considering where the money flows, the cap values, and the actual CO2 emissions. There are many interesting aspects of the program that I have not covered. These include offsets, where generators can invest in projects such as landfill methane gas capture, re-forestation, EE investments in the building sector, etc., to offset their carbon emissions. There is also a two-sided cost containment reserve – a reserve pricing mechanism that provides a floor price for carbon and a high-price trigger that allows sale of banked allowances to provide a lid on prices: in 2017, the minimum carbon price is $2.15/ton CO2 and the high-price trigger is $10/ton CO2. These might be good topics for future posts.

We can conclude that, since the start of the RGGI program, CO2 emissions have decreased significantly and have been way below the established caps. This has resulted in low allowance prices and the banking of a large volume of allowances by generators that can be used in the future. This has perpetuated low emissions pricing and, to compensate, the RGGI program recently implemented an even lower Adjusted Cap, which is hoped will draw banked allowances into the market and result in higher emissions prices in the future. The RGGI program has been in place since 2008 and a lot has been learned along the way. It was viewed as a model program for other regions when the Obama Administration’s Clean Power Plan (CPP) was in play. With that plan on hold for the foreseeable future, the future of the RGGI program remains a regional matter and the program review that is presently underway is crucial to its successful continuation beyond 2020. 

In my next post, I will take a look at the reasons behind that dramatic decrease in CO2 emissions over the past few years and the role of RGGI in this. Until then, do your part to keep emissions low by turning off the lights when you leave the room.

Mike Mooiman

Franklin Pierce University
mooimanm@franklinpierce.edu


Saturday, April 15, 2017

The Regional Greenhouse Initiative - Part 1

Like the snow in winter, there are annual legislative proposals we can count on: one of them is legislative action to pull New Hampshire out of the Regional Greenhouse Gas Initiative (RGGI). This has become a perennial component of the energy debate in NH, so I thought it would be useful to get a better understanding of this initiative and an appreciation of its pros and cons.

Understanding electricity rates in NH is a complicated business. There are transmission and distribution charges, systems benefit charges (some of which go into energy efficiency), and stranded costs. On top of these is the actual cost of electricity, which includes the cost of generation plus costs associated with RGGI and the NH renewable portfolio standard.

Let’s start by learning what RGGI is. The Regional Greenhouse Gas Initiative is a multistate carbon cap-and-trade plan that started in 2009. Nine states (Vermont, Massachusetts, Maine, Rhode Island, Connecticut, New York, Maryland, Delaware and New Hampshire) have agreed to cap regional emissions of carbon dioxide (CO2) from their power plants. (New Jersey was a member for a few years but withdrew in 2012.) Allowances for each ton of CO2 emissions, equal to the cap value, are issued by the RGGI program. Power generators are then required to purchase emissions allowances equivalent to the value of their own CO2 emissions in an auction market.  

A key feature of the program is that the cap ratchets down every year and fewer emission allowances become available.  Power generators adapt by reducing emissions through more efficient operations or equipment, by using renewable energy generation (such as solar or wind), or, if these alternatives are not possible, by purchasing CO2 emission allowances from the available pool. Over time, the reduction in emission allowance availability should make them more expensive and drive generation toward lower-carbon-emitting generation resources.

The appeal of this approach is that it uses market mechanisms—instead of regulatory command and control actions or carbon taxes—to reduce CO2 emissions. Generators make their own decisions as to what is best for their business and they can delay big investment decisions by simply purchasing emissions credits. Moreover, to meet the shrinking cap, the market creates incentives to find better and cheaper ways to reduce emissions through the use of technology. In the process, we and the planet benefit from reduced emissions. It is important to realize that this is not a zero-sum game. This mechanism puts a price on carbon and we, as ratepayers, fund the program; as the cap ratchets down every year, the cost of carbon will go up.

Cap-and-trade programs are not new. One of the most successful focused on acid rain. To deal with this problem, a national cap-and-trade system for sulfur dioxide (SO2) emissions was established. The market went to work, resulting in a 69% drop in SO2 emissions from 2005 to 2014.  The European Union also has a carbon emissions trading program, as do California and Quebec.

In the RGGI program, the money raised in the carbon allowance auction is returned to the participating states, so, because I am always interested in the money flow in these programs, I prepared the figure below to aid my understanding.

Let’s start on the left side of the diagram with the generators. A power plant generates electricity and is required to purchase the corresponding carbon allowance equivalent to their emissions through the RGGI auctions. The cost of the allowance becomes part of the cost of electricity costs that the generator charges to the utilities. The utilities then turn around and charge the ratepayers for the costs of electricity, which include the embedded RGGI costs (red arrows). As a result, there is a money flow from the ratepayers to the utilities to the generators to the RGGI auction pool (blue arrows). Proceeds from the RGGI auctions are returned to the states, where some of the money returns directly to ratepayers in the form of annual RGGI rebates or is used to fund state energy-efficiency (EE) programs. Within this money flow, good things happen, as shown by the green arrows: local jobs in the EE marketplace are created, appliances and materials are purchased from NH businesses, energy demand is reduced (which should help reduce electrical rates increases in the future), and CO2 emissions from electricity generation are reduced.   


From 2009 to 2016, $2.63 billion of RGGI auction funds were raised, of which NH received $116 million in proceeds. Participating states make their own choices as to how the funds are allocated: these are typically directed to EE, renewable and clean energy, greenhouse gas abatement, and direct bill-assistance programs. But, for some, RGGI funds represent a tempting target and various participating states have, at different times, redirected those funds to other purposes: even NH, in 2010, directed $3.1 million in RGGI proceeds to the NH general fund to meet budget shortfalls.

During the early years of the program, most of the RGGI funds returned to NH were used for EE programs. In 2012, however, House Bill 1490 legislation mandated that only the first $1/ton CO2 from the  CO2 emissions allowance auction proceeds could be used towards EE: anything beyond that has to be rebated directly to electricity ratepayers. This significantly reduced funds available for EE investments and these remaining funds were then allocated through NH’s Core EE program.  This is important because recent auction prices for carbon emissions have been of the order of $3 to $5/ton, so only a small fraction of RGGI proceeds are directed to EE, with the larger portion now going to direct bill rebates. There have been other tweaks to program, including a required allocation of 15% of the funds to low-income weatherization programs and $2 million set aside for municipal EE programs.

The RGGI program reports how the participating states use their funds in a series of annual reports, but these are not particularly current: the most recently available only includes data to 2014. To provide updated results, I used the RGGI auction results for 2015 and 2016, factored in the administration and RGGI Inc. costs, and split the remaining funds, taking in account that only the first $1/ton CO2 of the auction proceeds are allocated to EE. The rest goes to direct bill rebates. My estimates for the cumulative allocation of the funds since inception of the program are presented below. This indicates that, so far, the funds have been split evenly between EE and bill rebates. With time and higher CO2 allowance prices, however, we will see direct bill rebates becoming a larger part of the allocation pie in the future. 


In conclusion, the RGGI program has raised a great deal of money from ratepayers through higher electricity rates since 2009 and NH has received ~$115 million of the RGGI proceeds. To date, about half this money has been returned to rate payers and the other half has gone to EE initiatives. The EE portion is particularly important as it creates a virtuous circle of sales of local goods and services, the creation of local jobs, reduced energy usage, and lower carbon dioxide emissions.

With most of the NH RGGI funds now going to direct bill rebates, we have created this odd construct in which ratepayers pay RGGI costs monthly through their electricity bills and then once a year they get a rebate for most of those cumulated RGGI costs. In this money flow, some of the funds make their way to important and beneficial EE projects, but there is also a portion (~5%) that goes to supporting the administration and overheads associated with the RGGI program.

Even though this money flow might appear convoluted and inefficient, we should not lose sight that the objective of the RGGI program is to put a carbon price on electricity generation, to use market mechanisms to create the incentives to reduce carbon emissions, and to direct some money to beneficial EE projects.  

Until my next post, in which I will look at how successful the RGGI program has been in reducing CO2 emissions, do your bit to reduce carbon emissions by remembering to turn off the lights when you leave the room.

Mike Mooiman

Franklin Pierce University
mooimanm@franklinpierce.edu